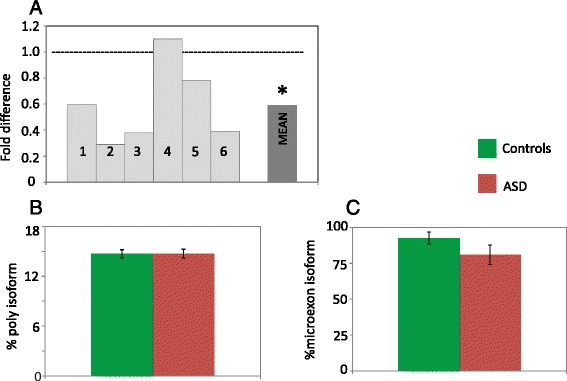
Fig. 4.

a RELN gene expression in six ASD post-mortem brains relative to their matched control and mean ASD/control fold difference; the hyphenated line corresponds to no case-control difference in mRNA levels. *two-tail p < 0.05. b Mean proportion of alterative polyadenylation and c microexon RELN isoforms for controls (green) and for ASD (red); error bars correspond to the standard error of the mean
