
Fig. 4.
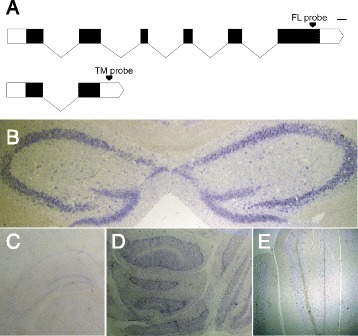
RIC-3 expression in mouse brain by in situ hybridization. a Schematic representation of the transcripts encoding the FL and TM isoforms and loci of the isoform-specific probes. Lines, introns, black filled bars coding sequences, white filled bars non-coding (UTRs). Scale bar, 100 bp, size of non-coding sequences is not to scale. b representative image of FL expression in hippocampus. c Representative image of TM expression in hippocampus. d Representative image of FL expression in cerebellum. e Representative image of TM expression in cerebellum