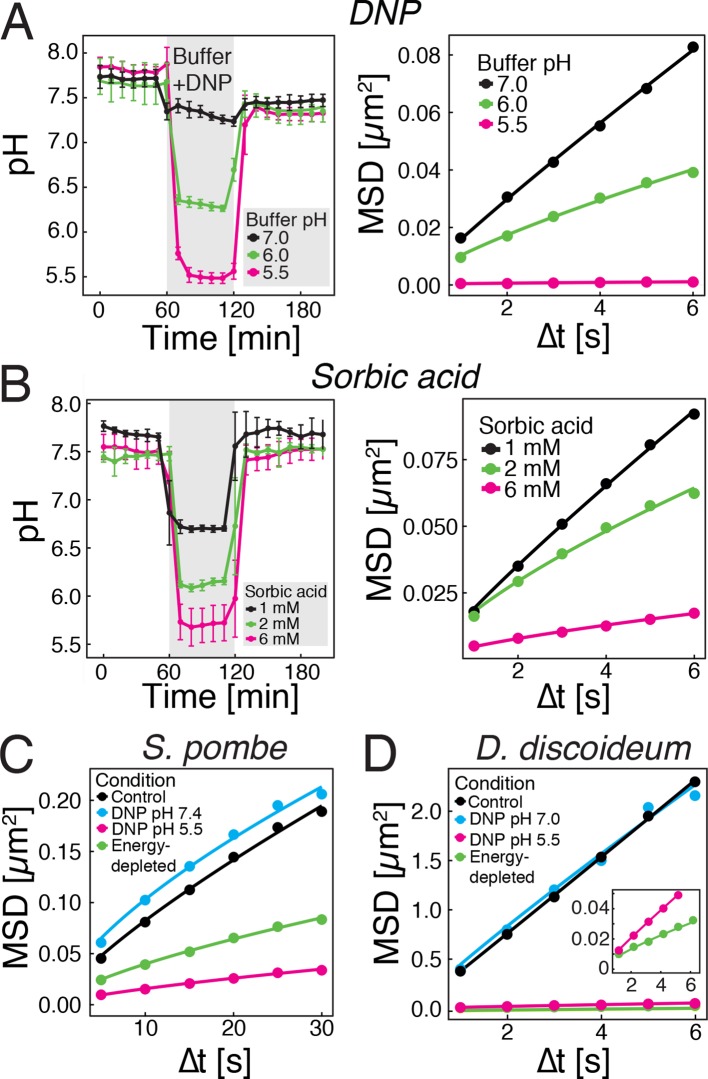
Figure 3. Acidification of the cytosol reduces particle mobility.
(A) The cytosolic pH of yeast cells exposed to phosphate buffers of different pH containing 2 mM 2,4-dinitrophenol (DNP) and 2% glucose was measured over time in a microfluidic flow chamber (left). The MSD of GFP-µNS particles tracked under the same conditions is shown on the right. (B) The cytosolic pH of yeast cells exposed to synthetic complete medium (pH ~5.5) containing increasing concentrations of sorbic acid was measured in a microfluidic flow chamber (left). The MSD of GFP-µNS particles tracked under the same conditions is shown on the right. (C) MSD of GFP-µNS particles in S. pombe cells. Particles were tracked in untreated cells (control), energy-depleted cells and cells treated with phosphate buffers of different pH containing 2 mM DNP. (D) MSD of GFP-µNS particles in D. discoideum cells. Particles were tracked in untreated cells (control), energy-depleted cells and cells treated with Lo-Flo buffer of different pH containing 0.2 mM DNP. Cells were energy-depleted in growth media or buffer, respectively, without glucose containing 2-deoxyglucose and antimycin A. All MSD plots represent time-and-ensemble averaged MSDs and particles of all sizes were considered.

