. 2016 Mar 22;5:e09347. doi: 10.7554/eLife.09347

Figure 5. Mechanical characterization of acidified and energy-depleted cells.

(A) The apparent elastic modulus of S. cerevisiae spheroplasts (without rigid cell walls) at pH 7.4 (E = 636 ± 16 Pa (mean ± SEM); N = 249) and pH 6.0 (E = 1459 ± 59 Pa; N = 257) was measured by AFM-based indentation. The cytosolic pH of spheroplasts was adjusted with phosphate buffers of pH 6.0 and pH 7.4, respectively, containing 2 mM DNP, 1% glucose and 1 M sorbitol. (B) The same cells as in (A) characterized with real-time deformability cytometry (RT-DC). Each measured cell results in a dot in this deformation-cell diameter plot. Also shown are 90% (solid) and 50% (dashed) density lines, and the histograms of size and deformation including Gaussian fits. (C) The cell wall of rod-shaped S. pombe cells was removed under control, energy depletion, and pH-adjusted conditions. The cytosolic pH of cells was adjusted during spheroplasting with phosphate buffers of pH 5.5 and pH 7.4, respectively, containing 2 mM DNP, 2% glucose, 1 M sorbitol and cell wall-digesting enzymes. Cells were energy-depleted in growth medium without glucose containing 20 mM 2-deoxyglucose and 10 µM antimycin A for 2 hr prior to spheroplasting. Energy depletion was continued during spheroplasting by including 20 mM 2-deoxyglucose and 10 µM antimycin A in the spheroplasting buffer. (D) The roundness of more than 160 cells per condition at the start of the experiment and after 3 hr of incubation in the presence of cell wall digesting enzymes (end) was quantified. ∗∗p<0.01; ∗∗∗p<0.001.

DOI: http://dx.doi.org/10.7554/eLife.09347.020

Figure 5.

Figure 5—figure supplement 1. (Left) The apparent elastic moduli of S. cerevisiae spheroplasts, incubated in phosphate buffers of different pH in the presence and absence of DNP, were determined by AFM-based indentation.

Figure 5—figure supplement 1.

Independent measurements were repeated at least four times, with a total of N = 242–409 cells, for each condition. Cells were significantly stiffer at pH 6.0 (E = 1459 ± 59 Pa; mean ± SEM) than at pH 7.4 (E = 636 ± 16 Pa) and in the presence of DNP. Without DNP there was no statistically significant difference in stiffness between extracellular pH 6.0 and pH 7.4 (975 ± 39 Pa and 947 ± 27 Pa, respectively). Boxes show the 25th, 50th (the median), and 75th percentiles, whiskers the spread of the data (excluding outliers), and a square the mean score for a group. Mann-Whitney-tests were used to statistically compare two groups. Asterisks *** indicate significance level p<0.001. (Middle) The apparent elastic modulus of S. cerevisiae cells with and without cell wall was determined by AFM-based indentation. It is E = 1.3 ± 0.2 MPa (mean ± SEM; N = 69) for cells with cell wall and E = 975 ± 39 Pa (mean ± SEM; N = 409) for cells without cell wall (same data as for pH 7.4 w/o DNP in the left panel). (Right) Typical force-distance curves are shown for both pH values in the presence of DNP. The cytosolic pH of spheroplasts was adjusted with phosphate buffers of pH 6.0 and pH 7.4, respectively, containing 2 mM DNP, 1% glucose and 1 M sorbitol.
Figure 5—figure supplement 2. The viscosity of the spheroplasted cells, extracted from the AFM-based indentation-retraction curves, decreased from η = 90 ± 16 Pa s (mean ± SEM; N = 31) at pH 7.4 to η = 70 ± 14 Pa s (N = 23) at pH 6.0.

Figure 5—figure supplement 2.

Boxes show the 25th, 50th (the median), and 75th percentiles, whiskers the spread of the data (and a few outliers). Asterisk * indicates significance level p<0.05 (Mann-Whitney-test).
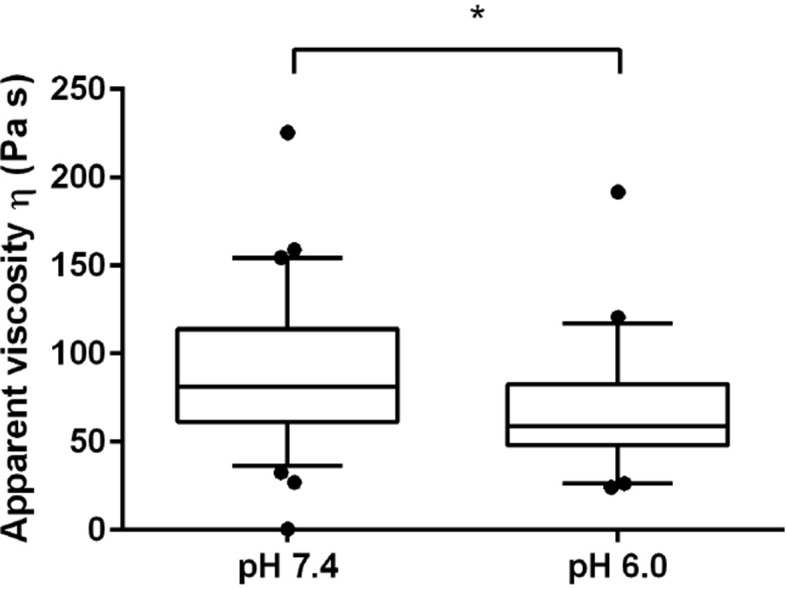
Figure 5—figure supplement 3. The volume of pH-adjusted (left panel) and sorbitol-treated (right panel) yeast cells was measured with an imaging-based method (see materials and methods).

Figure 5—figure supplement 3.

The cytosolic pH was adjusted by treating cells with phosphate buffers of indicated pH containing 2 mM DNP and 2% glucose. Sorbitol treatment was done in synthetic complete medium. The term 'relative cell volume' is used to indicate that the volume of control cells (Ctrl, cells in synthetic complete medium) was normalized to 100%. More than n=160 cells were measured for each condition. Values are given as mean +/- SEM. ** Indicates a p-value < 0.01, *** a p-value < 0.001.
Figure 5—figure supplement 4. Both low pH and sorbitol treatment cause a reduction in particle mobility.

Figure 5—figure supplement 4.

MSD of GFP-µNS particles in cells exposed to increasing concentrations of sorbitol and in cells adjusted to low pH. The cytosolic pH was adjusted by treating cells with phosphate buffers of pH 5.5 containing 2 mM DNP and 2% glucose. Sorbitol treatment was done in synthetic complete medium containing the indicated amount of sorbitol.
Figure 5—figure supplement 5. The diffusivity of a mCherry-GFP fusion protein was measured with fluorescence recovery after photobleaching (FRAP) in cells exposed to different concentrations of sorbitol (left panel), cells adjusted to different cytosolic pH (middle panel), and in energy-depleted cells (right panel).

Figure 5—figure supplement 5.

Sorbitol treatment was done in synthetic complete medium containing the indicated amount of sorbitol. The cytosolic pH was adjusted by treating cells with phosphate buffers of pH 5.5, pH 6.0 and pH 7.4, respectively, containing 2 mM DNP and 2% glucose. Cells were energy-depleted in synthetic complete medium (standard pH of 5.5) without glucose containing 20 mM 2-DG and 10 μM antimycin A. Each curve represents the average of more than 5 measurements in different cells.
Figure 5—figure supplement 6. Energy-depleted S. pombe cells retain a rod-like shape in the absence of a cell wall.

Figure 5—figure supplement 6.

Left: Energy-depleted S. pombe cells before (top) and after (bottom) cell wall removal. BF: Bright field image. Calcofluor white staining confirms the presence of a cell wall before and absence of a cell wall after enzymatic removal. Right panel: Averaged line profiles through cells (red lines indicated on the left show examples of line scans in representative cells). Measurements were carried out for 10 individual cells before and after cell wall removal, respectively. Note the different axis scales indicating strong differences in calcofluor staining intensity. Measurements were carried out for 10 individual cells before and after cell wall removal, respectively.
Figure 5—figure supplement 7. Cell wall digesting enzymes work equally well in buffers of different pH.

Figure 5—figure supplement 7.

Top: Still images of cells incubated with and without (Ctrl) cell wall removing enzyme mix in buffers of indicated pH. No sorbitol was added in order to allow for cell lysis upon cell wall removal. Bottom left: Quantification of the lysing activity (absorbance at 595 nm) as a function of time. Absorbance only decreases after addition of the enzyme mix (arrow, time 0). Bottom right: The activity of the enzyme mix at different pH was derived from the plot shown on the bottom left by linear regression. Enzyme activity is given as the change of absorbance per minute (Abs./min).
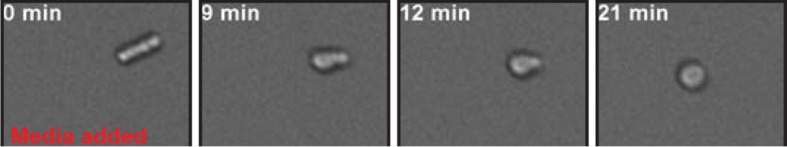
Figure 5—figure supplement 8. Energy-depleted S. pombe cells were imaged by time-lapse bright field microscopy after addition of the cell wall removing enzyme mix.

Figure 5—figure supplement 8.

Still images show multiple events (yellow arrows) in which the cell body separates from the cell wall sheath and maintains its rod-like shape. Also see corresponding Video 6.
Figure 5—figure supplement 9. Low pH adjusted, rod-shaped S. pombe spheroplasts round up when exposed to glucose-containing medium.

Figure 5—figure supplement 9.

Prior to imaging the spheroplast was kept in phosphate buffer of pH 6.0 containing 1 M sorbitol and 2 mM DNP and did not round up for several hours. At time point 0 min the buffer was replaced with EMM5 medium containing glucose and 1 M sorbitol. Sorbitol was added to osmotically stabilize the cells. Also see corresponding Video 7.