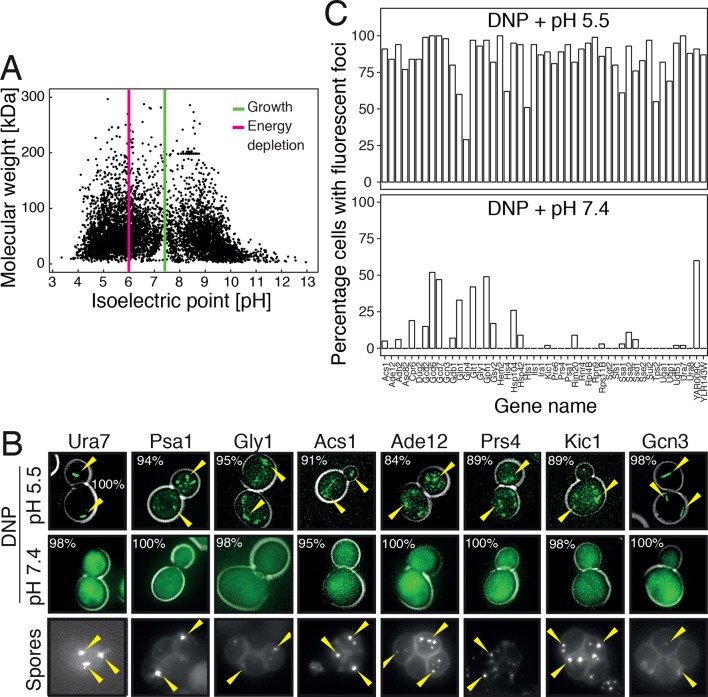
Figure 6. Acidification of the cytosol causes widespread assembly of cytoplasmic proteins.
(A) The isoelectric points and the molecular weight of all yeast proteins were computed from their primary amino acid sequence and plotted as a virtual 2D gel. The green line indicates optimal growth pH, the red line indicates pH reported for dormant yeast cells. (B) We systematically tested the response of 68 cytoplasmic proteins to a drop in cytosolic pH. Shown are representative images of proteins that responded with assembly formation to low pH. The same proteins also form assemblies in yeast spores. (C) The percentage of cells showing protein assemblies at high versus low pH was quantified. The cytosolic pH was adjusted by treating cells with phosphate buffers of pH 5.5 and pH 7.4, respectively, containing 2 mM DNP and 2% glucose.
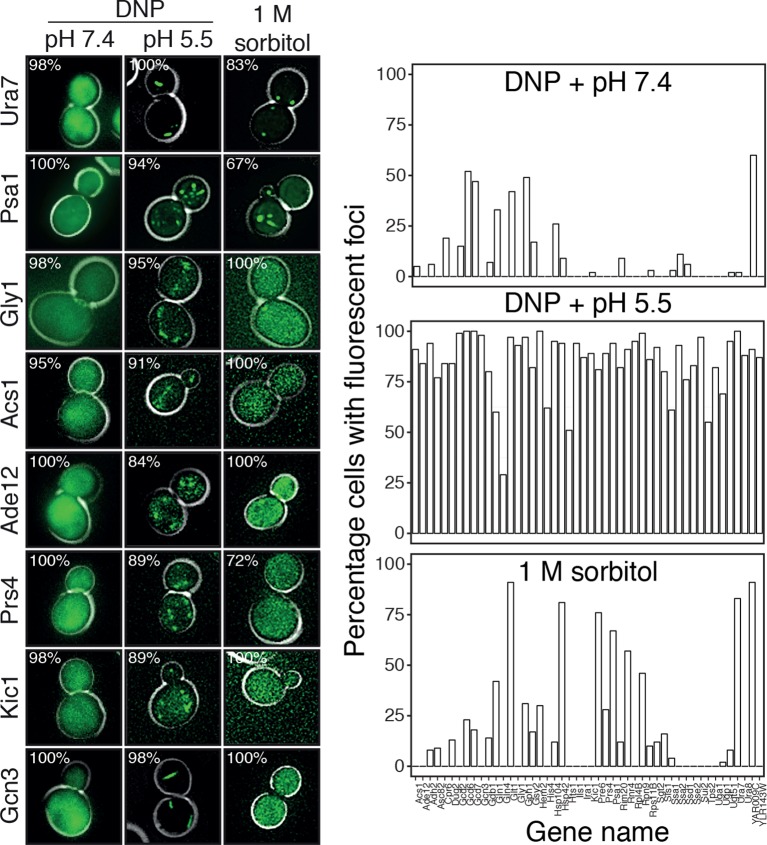
Figure 6—figure supplement 1. Response of 68 cytoplasmic proteins to a drop in cytosolic pH and to treatment with 1 M sorbitol.
Figure 6—figure supplement 2. Different subunits of the hetero-pentameric eIF2B complex colocalize in the same filamentous structures, suggesting that these protein retain their native-like structure when they form higher-order assemblies.


