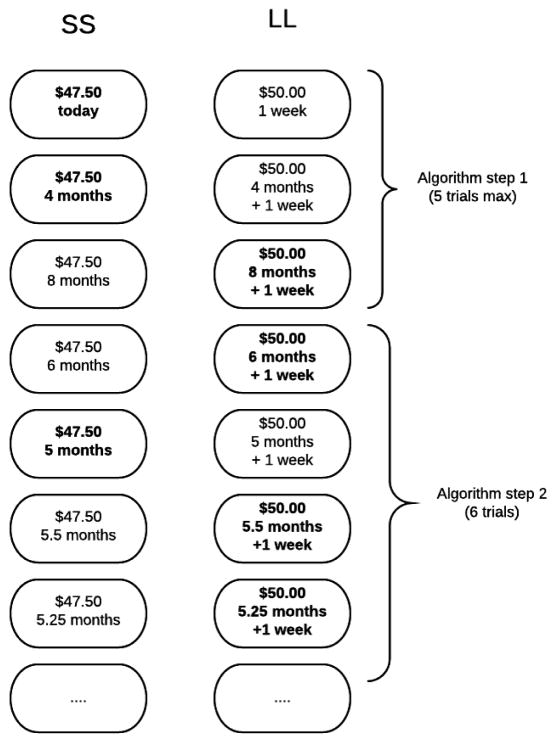
Figure 2.
Diagram of hypothetical sequence of trials in the preference reversal task for a participant who exhibits a preference reversal in the $50, 7 day back-end delay condition. The left and right columns represent the smaller-sooner and larger-later alternatives, respectively. Each row represents a single trial, and the bolded alternative represents the selected alternative in the hypothetical sequence.

