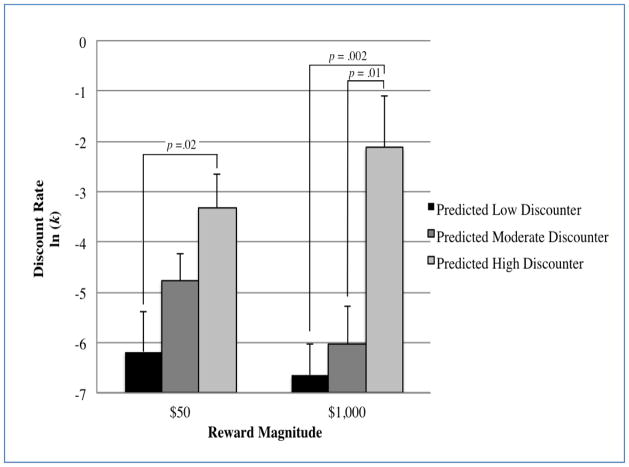
Figure 4.
Mean rate of delay discounting is shown as a function of classification (predicted low, moderate, high discounter) within each magnitude condition. All means are in the predicted direction, with statistically significant differences between predicted low-/high-discounters in the $50 condition, and between predicted low-/high- and moderate-/high-discounters in the $1000 condition.

