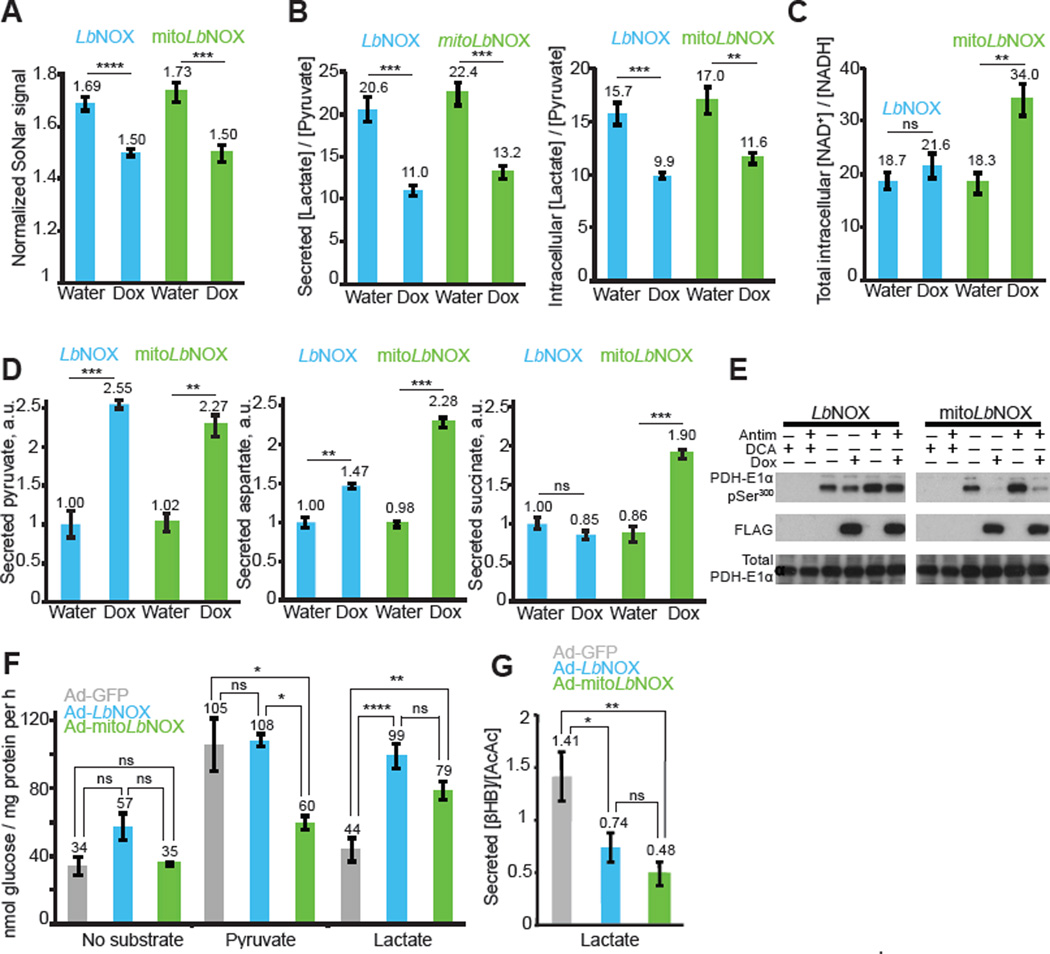
Figure 3. Effect of LbNOX and mitoLbNOX on NAD+/NADH ratios, metabolic fluxes, PDH phosphorylation and gluconeogenesis.
(A–C) Effect of LbNOX and mitoLbNOX expression in HeLa cells on (A) cytoplasmic NADH concentrations determined with fluorescence microscopy using SoNar expressing cells (n=7), (B) intracellular and secreted lactate/pyruvate ratio determined by LC-MS (n=4), and (C) intracellular NAD+/NADH ratios determined by HPLC (n=4). Student’s t-test. ns P > 0.05, ** P < 0.01, *** P < 0.001, **** P < 0.0001. Mean ± S.E. (D) Effect of LbNOX and mitoLbNOX expression in HeLa cells on release rate of pyruvate, aspartate and succinate, determined by comparing concentrations in spent versus fresh media. Student’s t-test. ns P > 0.05, ** P < 0.01, *** P < 0.001. Mean ± S.E., n=3 replicates from one experiment. (E) Effect of LbNOX and mitoLbNOX expression in HeLa cells on PDH phosphorylation. Representative gel from one of three independent experiments. (F) Effect of adenoviral transduction of GFP, LbNOX or mitoLbNOX on primary rat hepatocyte gluconeogenesis in DMEM containing no glucose, no glutamine and no pyruvate using either no substrate, 5mM pyruvate, or 5mM lactate. One-way ANOVA followed by Tukey’s multiple comparisons test. ns P > 0.05, * P < 0.05, ** P < 0.01, **** P < 0.0001. Mean ± S.E., n=3 (no substrate, pyruvate) or n=7 (lactate) independent experiments. (G) Effect of LbNOX and mitoLbNOX on secreted β-hydroxybutyrate/acetoacetate ratio in rat hepatocytes performing gluconeogenesis from lactate as a substrate. Metabolite levels determined using LC-MS. One-way ANOVA followed by Tukey’s multiple comparisons test. ns P > 0.05, * P < 0.05, ** P < 0.01. Mean ± S.E., n=10 independent experiments.

