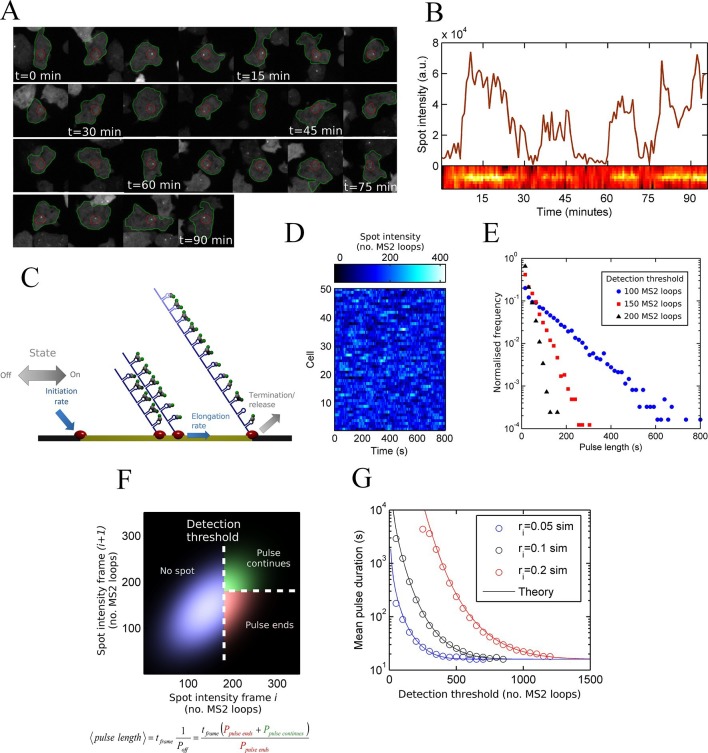
Figure 1. Measurement and theory of transcriptional fluctuations See also Figure 1—figure supplements 1 and 2.
(A) Montage of a cell identified and tracked throughout a time lapse movie showing the transcription spot fluctuating over time. Detected cell (green) and nuclear (red) boundaries are shown. (B) (Upper) Spot intensity trace for the cell shown in A. (Lower) Kymograph extracted from image, aligned with time axis of upper graph, showing the fluctuations in intensity of the region around the spot. (C) Monte Carlo simulation of MS2 system. Binding of polymerases at the start of the gene (initiation) and single nucleotide elongation steps are modelled as processes with one rate-limiting step. Additional steps could be added, such as termination/release from the gene. To simulate systems with switches in initiation rate, single rate-limiting steps are used to transition between different initiation states. (D) Simulated transcription site intensity fluctuations (total number of stem loops) for a promoter with a constant Poisson initiation rate. (E) Histogram of pulse durations for different detection thresholds. A pulse is defined as successive frames where the transcription site intensity is above a threshold number of loops. Experimentally, the threshold of detection is the intensity at which a spot is identifiable over background noise, and depends on the imaging conditions. (F) Two-dimensional histogram calculated from the bivariate Gaussian theory, showing the probability distribution of the transcription site intensity in two successive frames. Blue region - spot intensity below threshold in current frame; green region - intensity above threshold in both current and next frames; red region - spot intensity above threshold in current frame but below threshold in next frame. The average pulse duration is determined from the probability of the transcription spot disappearing between one frame and the next: P(off) = P(red)/(P(green) + P(red)). (G) The bivariate Gaussian theory accurately predicts the pulse durations of simulated data. Comparison of theory and simulation are shown for three different initiation rates (ri). Therefore, the duration of a visible transcription pulse depends on properties such as the exposure time, detection sensitivity and frame interval, and does not provide a simple readout of gene activity fluctuations.
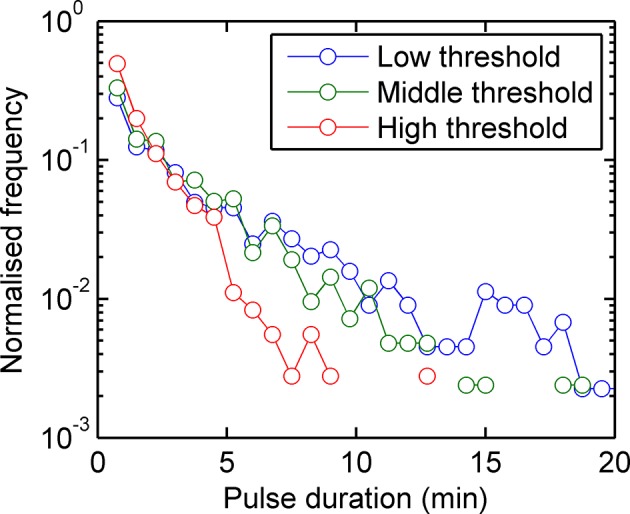
Figure 1—figure supplement 1. Experimental pulse durations obtained by applying various thresholds of detection: low - 4000 arbitrary intensity units (a.u.), middle - 8000 a.u. and high 16,000 a.u.

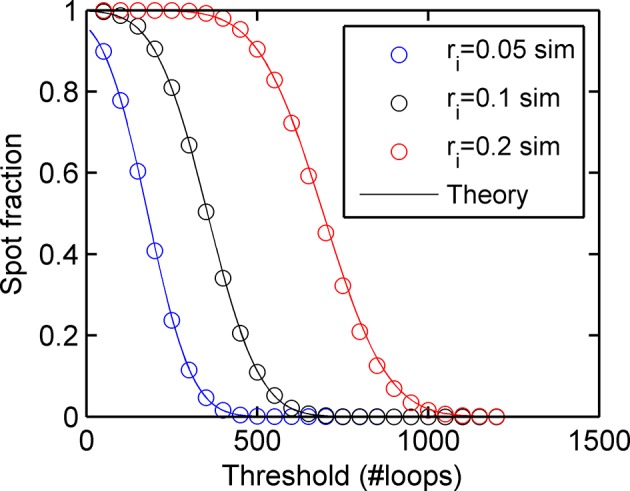
Figure 1—figure supplement 2. Agreement between simulations and bivariate Gaussian theory of spot frequency (fraction) (right) as a function of detection threshold.


