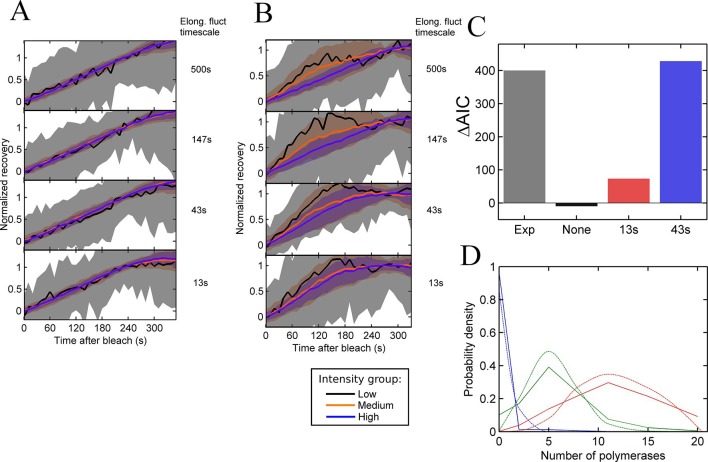
Figure 4. Testing the contribution of elongation rate switching to intensity fluctuations See also Figure 4—figure supplement 1.
A and B Simulated FRAP measurements for a system with three states of initiation rate and two elongation rate states. Initiation rate dynamics are chosen to match those observed experimentally, while the timescale of elongation rate fluctuations is varied from 500 s (top panel) to 13 s (bottom panel) between 10 bases/s and 30 bases/s. In A, the elongation rate for each polymerase fluctuates independently from other polymerases, whereas in B, all polymerases move with a global fluctuating elongation rate. The simulated data are subdivided equally between three bins of low (black), medium (orange) and high (blue) spot intensity, as with the experimental data in Figure 2D. Differences between bins are only apparent with global fluctuations. Variability is shown with standard deviations. (C) Effects of elongation rate fluctuations on the 3-state simulation. The y-axis shows the increase in complexity produced by adding elongation fluctuations to a three-state simulation, compared with experimental results. Simulated data is slowly varying three-state initiations with fast-varying two-state elongations. Simulations with fast fluctuations (13 s) show a small improvement in fit above three states (red bar). Simulations with 43 s timescale elongation fluctuations (blue) show an improvement in fit comparable to experimental data (grey). (D) Polymerase distributions in three-state model fit for 3-state simulation with 43 s elongation fluctuations (solid, straight lines), compared with Poisson best fit (dotted, curved lines).
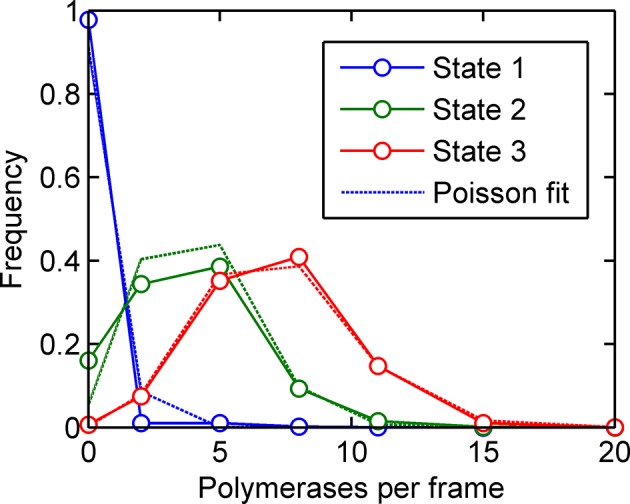
Figure 4—figure supplement 1. Training a three-initiation-state model on simulated data with three initiation states and no elongation rate fluctuations (see main text).


