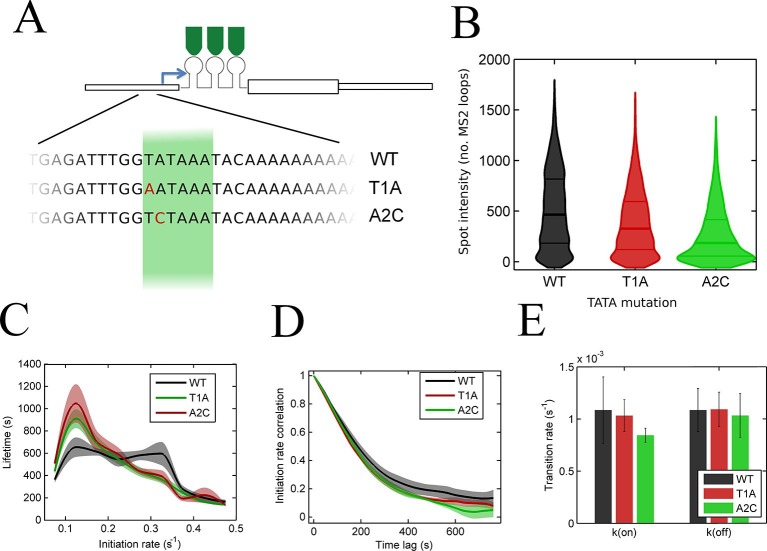
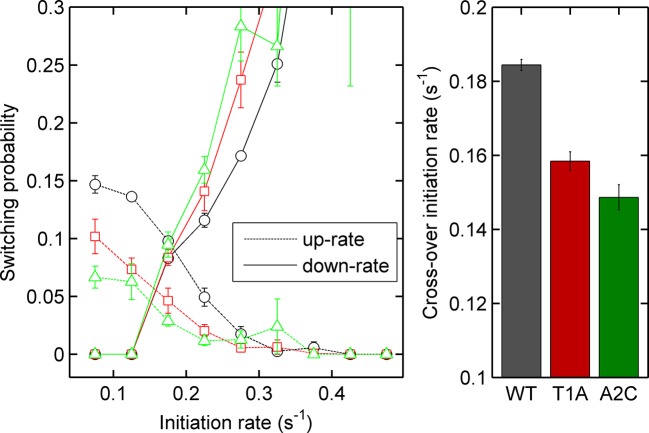
Figure 5. The TATA box influences access to the high activity states.
See also Figure 5—figure supplements 1–4. (A) TATA box mutations studied for the act5 gene. (B) Probability density function of transcription site intensity for TATA mutations T1A and A2C compared to WT. One of four biological replicates is shown. The reduction in intensity in the TATA mutations is slight, but significant (KS test: p=10–58 for wt vs. T1A and p=10–158 for wt vs. A2C). (C) Lifetime of constant initiation rate pulses in the active state, as a function of initiation rate for TATA mutants compared to control. The TATA mutants spend longer in lower initiation states and shorter durations at high initiation rates. The curves display mean and S.E.M. from 4 independent experiments (with 1686–6350 individual frames from 44–145 individual cell tracks, from each cell line, from each of the 4 replicates). We used grouped ratio t-tests to compare distributions, pooling the data based upon initiation rate. For low initiation rates (<0.2 s-1) gave p=0.0083 and 0.0015 for T1A and A2C respectively. For high rates (>0.25 s-1) gave p=3.5 x 10⁻⁵ and 0.0011. A breakdown of the data is contained in the Supplementary Material. (D) Timescale of initiation rate persistence, as measured by the decay of the autocorrelation of instantaneous initiation rate, is similar for TATA mutants and WT. (E) Estimated rates of transition from closed to open state (k(on)) and from open to closed state (k(off)). Values are average of 4 experiments. Error bars are S.E.M. Differences are all non-significant (p all >0.45).
Figure 5—figure supplement 1. Example WT spot intensity traces.
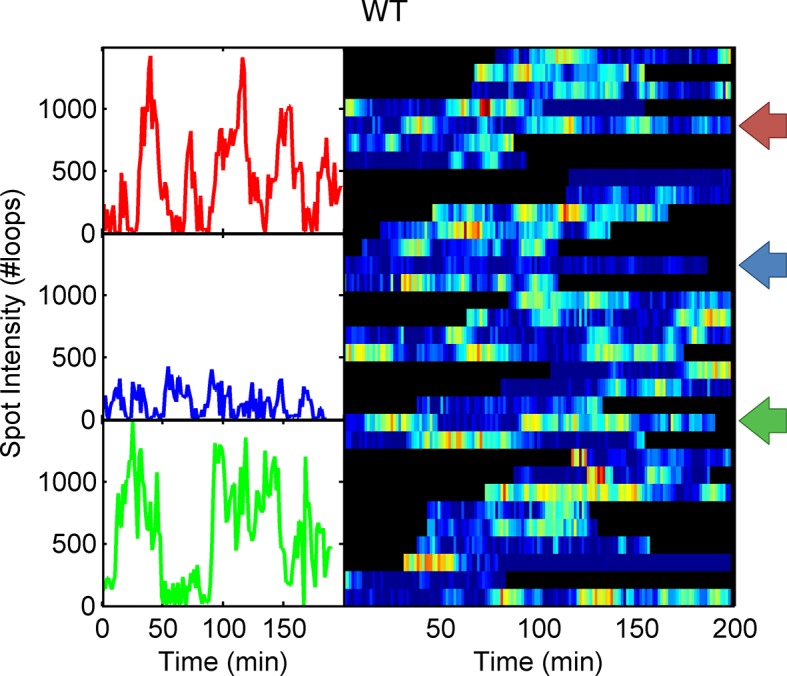
Figure 5—figure supplement 2. Example spot intensity traces for the A2C TATA box mutation cell line.
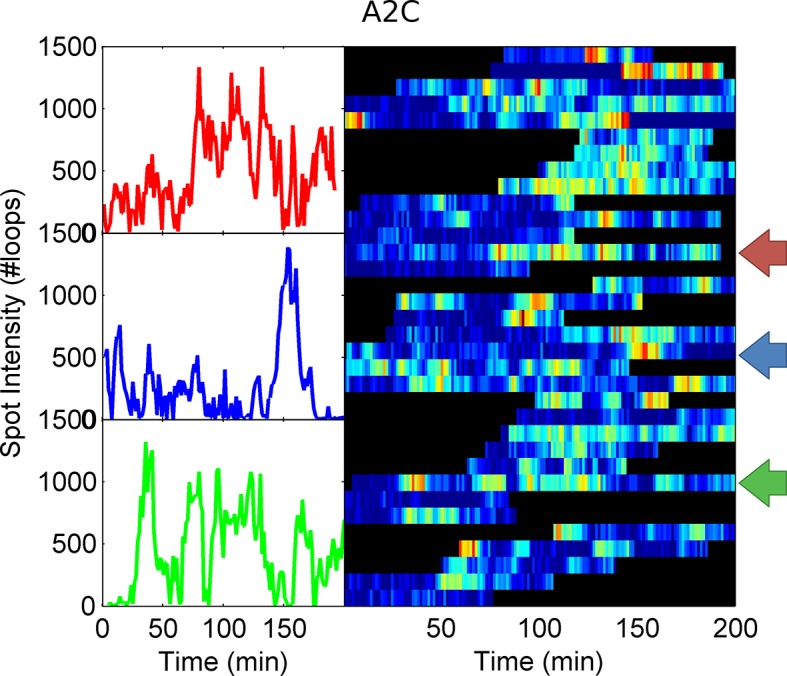
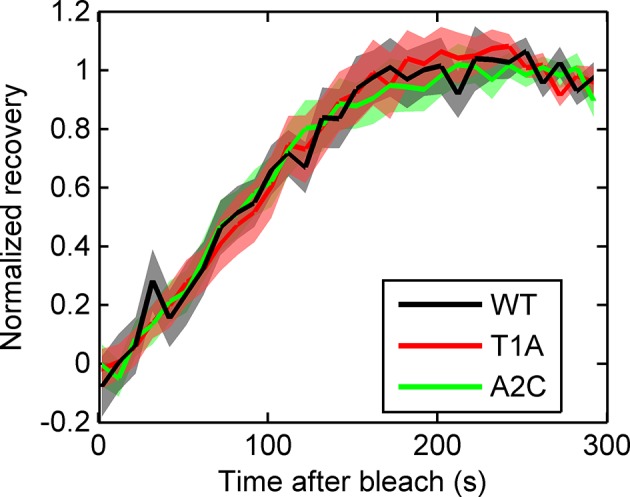
Figure 5—figure supplement 3. Fluorescence recovery after photobleaching (FRAP) curves show no evidence for different RNA dwell times in the TATA mutants (T1A, A2C) compared to wild type (WT).
