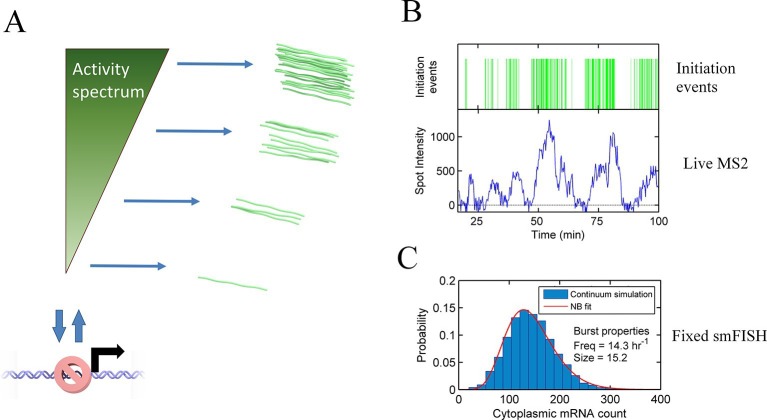
Figure 6. Continuum model.
See also Figure 6—figure supplements 1 and 2. (A) Proposed continuum model. In addition to switches to and from a closed state on the timescale of around ten minutes, the initiation rate in the active state fluctuates on a shorter timescale. (B) Simulation of the continuum model, resulting in temporal variation in the initiation rate (upper, green spikes). The short integration time of MS2 measurements (the time for which RNA is retained at the transcription site) means fluctuations in the active state of the gene can be visualized (lower). (C) In simulated smFISH data (right), using the RNA production events from the continuum model (B) and a cytoplasmic RNA decay time of 40 min, the distribution is well described by a standard two state bursting (negative binomial, NB) model. The long lifetime of cytoplasmic RNA averages out the temporal fluctuations in the initiation rate.
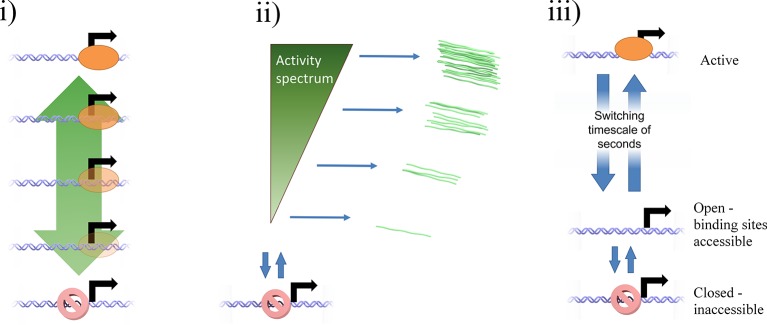
Figure 6—figure supplement 1. Potential mechanisms by which a continuum of activity (ii) may arise: (i) a ladder containing a large number of discrete states, each with a distinct initiation rate, caused by specific binding of transcription factors or epigenetic marks.
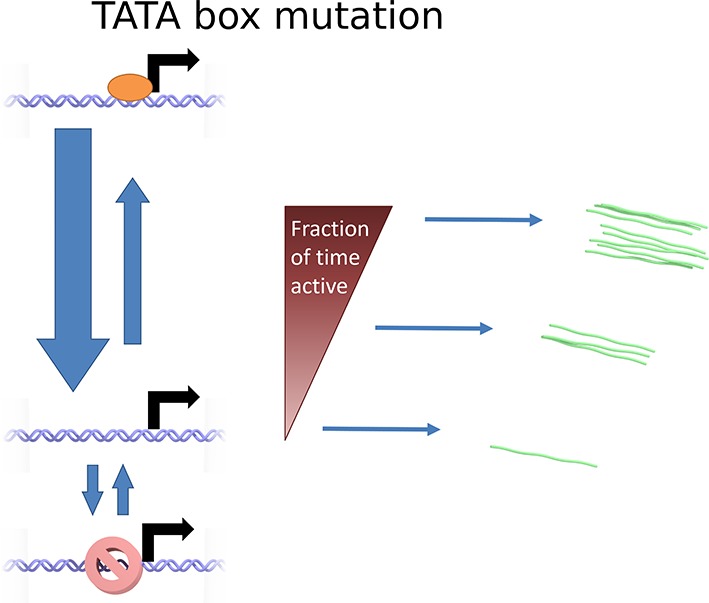
Figure 6—figure supplement 2. Cartoon illustrating the continuum model and the predicted changes caused by TATA sequence modification.


