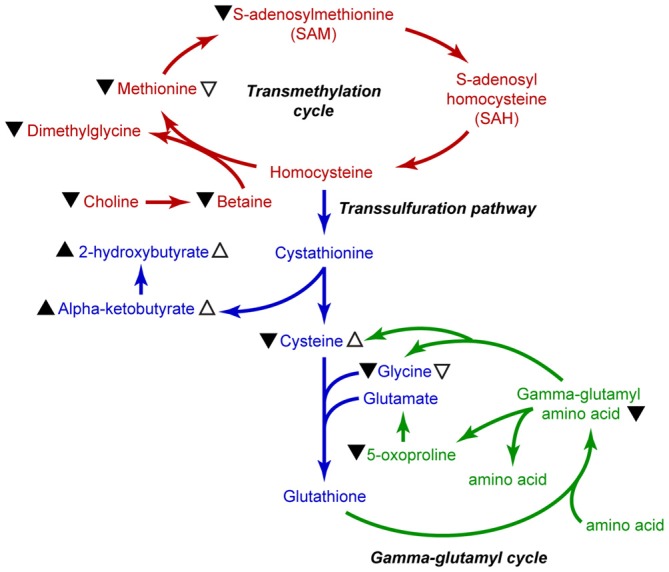
Figure 6.

Summary illustration of methionine metabolic pathways. Metabolites of the transmethylation pathway are indicated in red, the transsulfuration pathway is indicated in blue, and the gamma-glutamyl cycle is shown in green. Black arrowhead (▴) indicates changes in metabolite levels in the plasma of sTBI patients. Open arrows (▵) indicate significant changes measured in the mTBI patients as compared to HV. Up arrowheads indicate increased levels, whereas down arrowheads indicate decreased levels.
