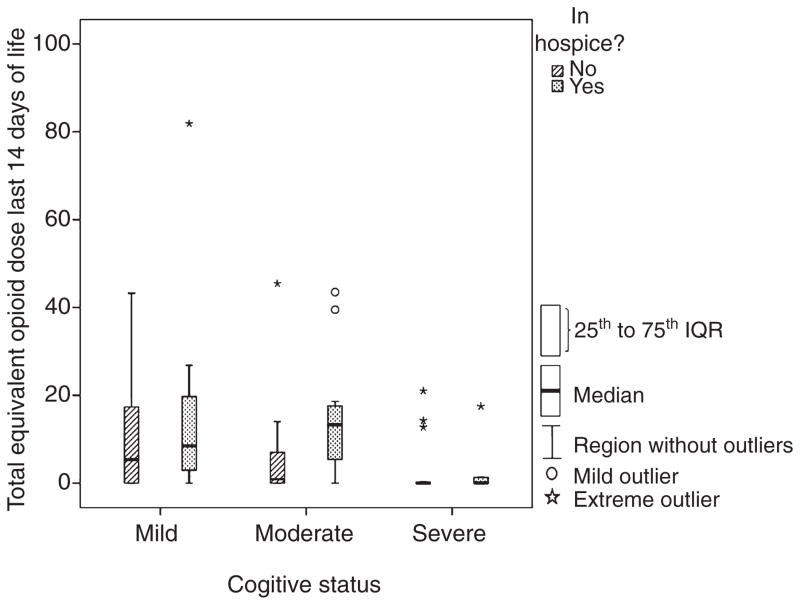
Figure 1.
Box and whisker plot. The y-axis = total equivalent doses of opioid analgesic standardized to 1 mg of levorphanol = 1 equivalent dose unit (range 0–82). The x-axis = cognitive status reported in Cognitive Performance Scale (CPS) scores (range 1–6). Mild dementia = CPS of 1 and 2, moderate dementia = CPS of 3 and 4, severe dementia = CPS of 5 and 6. Note: No resident with a CPS score of 6 (n = 12) was enrolled in hospice.

