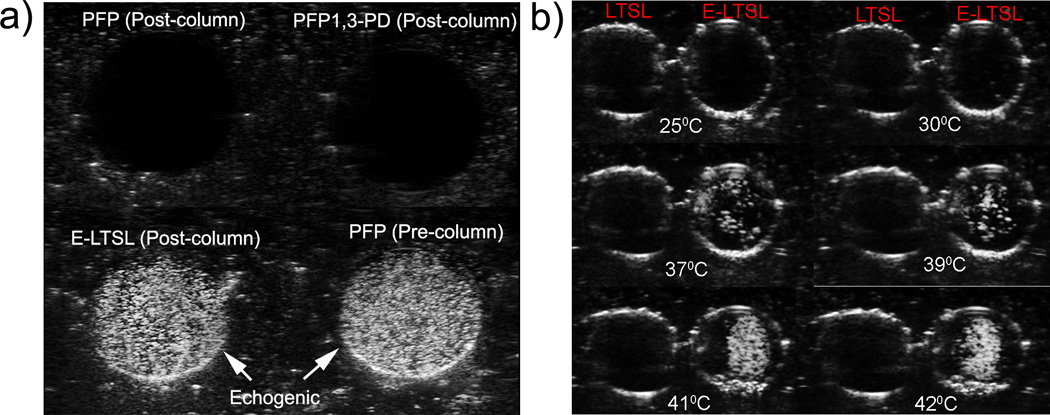
Figure 3.

Ultrasound images of LTSL and E-LTSL from the phantom study. (A) Column purified PFP mixture containing PFP or 1,3-PD plus PFP showing no echogenicity (dark round black circle, top panel), whereas column purified E-LTSL sample showing similar echogenicity like unpurified PBS mixture containing PFP (white circular regions, bottom panel), (B) US intensity of LTSL and E-LTSL from 25–42 °C. A substantial increase in US intensity is noted at higher temperatures.
