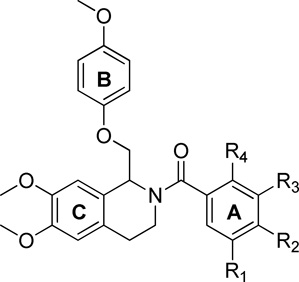
Table 1.
Optimization of substituent placement on Ring A.
 | ||||||||
|---|---|---|---|---|---|---|---|---|
| I10 µM / ICONTROL (mean ± SEM, %) |
EC50 (maximal potentiation) (µM, %)a |
|||||||
| R1 | R2 | R3 | R4 | GluN2C | GluN2D | GluN2C | GluN2D | |
| 1 | H | H | H | H | 116 ± 2.9 | 123 ± 2.3 | 12 (145%) | 11 (156%) |
| 184 | H | Me | H | H | 106 ± 5.1 | 107 ± 2.4 | -- | -- |
| 185 | H | H | Me | H | 171 ± 11 | 132 ± 10 | 6.2 (211%) | 5.5 (174%) |
| 186 | H | H | H | Me | 108 ± 2.0 | 96 ± 1.7 | -- | -- |
| 187 | H | Cl | H | H | 128 ± 3.2 | 111 ± 4.1 | 4.1 (135%) | -- |
| 2 | H | H | Cl | H | 193 ± 7.3 | 179 ± 5.7 | 4.6 (233%) | 5.0 (215%) |
| 188 | H | H | H | Cl | 102 ± 7.1 | 101 ± 8.9 | -- | -- |
| 189 | H | Br | H | H | 107 ± 3.2 | 108 ± 3.1 | -- | -- |
| 190 | H | H | Br | H | 183 ± 11 | 178 ± 6.6 | 0.9 (195%) | 2.2 (188%) |
| 191 | H | OMe | H | H | 101 ± 1.1 | 96 ± 1.9 | -- | -- |
| 192 | H | H | OMe | H | 147 ± 12 | 132 ± 10.5 | 5.8 (181%) | 12 (179%) |
| 193 | H | NO2 | H | H | 96 ± 1.4 | 102 ± 1.8 | -- | -- |
| 84 | H | H | NO2 | H | 160 ± 7.4 | 151 ± 6.3 | 11 (250) | 13 (261) |
| 85 | H | Cl | Cl | H | 126 ± 5.2 | 136 ± 5.0 | 21 (178%) | 24 (220%) |
| 86 | H | H | Cl | Cl | 120 ± 3.1 | 109 ± 8.4 | 1.4 (127%) | -- |
| 194 | H | Cl | H | Cl | 112 ± 5.0 | 99 ± 3.1 | -- | -- |
| 87 | Cl | H | Cl | H | 149 ± 8.0 | 138 ± 8.2 | 4.8 (201%) | 1.9 (159%) |
| 88 | H | F | Cl | H | 183 ± 13 | 168 ± 10 | 5.3 (232%) | 5.3 (206%) |
| 195 | H | O-CH2-O | H | 106 ± 3.6 | 99 ± 1.5 | -- | -- | |
Fitted EC50 values are shown to two significant digits when potentiation at 10 µM test compound exceeded 115%; values in parentheses are the fitted maximum response as a percentage of the initial glutamate (100 µM) and glycine (30 µM) response. Data are from between 6–25 oocytes from 2–5 frogs for each compound and receptor tested.
