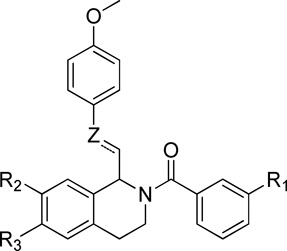
Table 9.
Optimization of Linker B
 | |||||||||
|---|---|---|---|---|---|---|---|---|---|
| I10 µM / ICONTROL (mean ± SEM, %) |
EC50 (maximal potentiation) (µM, %)a |
||||||||
| R1 | R2 | R3 | Z | C=C | GluN2C | GluN2D | GluN2C | GluN2D | |
| 1 | H | OMe | OMe | O | No | 116 ± 2.9 | 123 ± 2.3 | 12 (145%) | 11 (156%) |
| 2 | Cl | OMe | OMe | O | No | 193 ± 7.3 | 179 ± 5.7 | 4.6 (233%) | 5.0 (215%) |
| 190 | Br | OMe | OMe | O | No | 183 ± 11 | 178 ± 6.6 | 0.9 (195%) | 2.2 (188%) |
| 154 | F | OMe | OMe | C | No | 92 ± 1.7 | 95 ± 2.3 | -- | -- |
| 155 | H | OMe | OMe | C | Yes | 122 ± 4.4 | 127± 5.1 | 35 (192%) | 35 (199%) |
| 156 | Cl | OMe | OMe | C | Yes | 169 ± 6.9 | 155 ± 6.4 | 1.1 (172%) | 1.3 (157%) |
| 157 | Br | OMe | OMe | C | Yes | 181 ± 17 | 169 ± 7.3 | 2.8 (188%) | 2.8 (174%) |
| 158 | Cl | H | OMe | C | Yes | 184 ± 13 | 187 ± 15 | 1.0 (190%) | 1.0 (192%) |
| 159 | Br | H | OMe | C | Yes | 172 ± 21 | 164 ± 11 | 1.5 (176%) | 1.7 (185%) |
| 160 | H | OMe | OMe | C | No | 102 ± 3.4 | 100 ± 2.9 | -- | -- |
| 161 | Cl | OMe | OMe | C | No | 114 ± 2.6 | 108 ± 2.0 | -- | -- |
| 162 | Br | OMe | OMe | C | No | 128 ± 5.2 | 134 ± 7.4 | 11 (129%) | 15 (128%) |
| 127 | H | OMe | OMe | S | No | 103 ± 4.3 | 94 ± 1.0 | -- | -- |
Fitted EC50 values are shown to two significant digits when potentiation at 10 µM test compound exceeds 115%; values in parentheses are the fitted maximum response as a percentage of the initial glutamate (100 µM) and glycine (30 µM) responses. Data are from between 6–25 oocytes from between 2–5 frogs for each compound and receptor tested. Compounds 1, 2, 190 are also shown in preceding Tables, and are included here for comparison.
