
Figure 1.
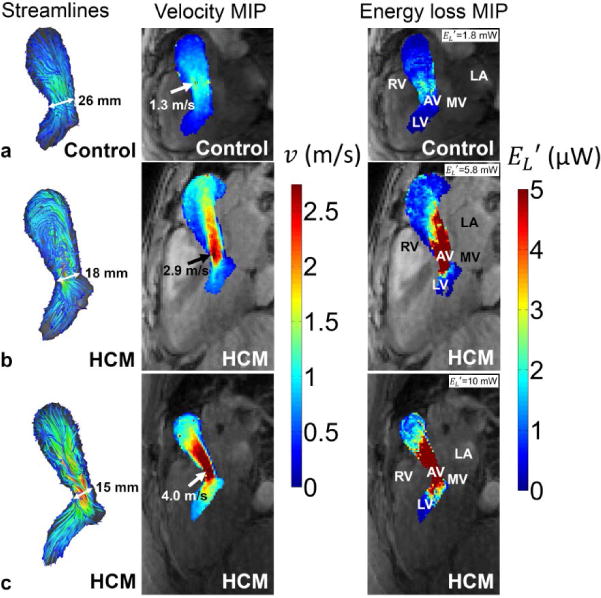
Peak systolic 3D streamlines (left column), velocity maximum intensity projections (mid column) and maximum intensity projections (right column) in the LVOT of (a) a control subject, (b) a HCM patient with helical flow and (c) a HCM patient with obstructed flow. The arrows point to the location of maximum velocity used for Bernoulli pressure gradient estimation. End diastolic LVOT diameters were smallest for the obstructive HCM patient (15 mm) compared to the HCM patient with helical flow (18 mm) and the age matched healthy control (26 mm). Note that the color coding of the maximum velocity (red color) corresponds to a pressure gradient of 30 mmHg. RV = right ventricle, AV = aortic valve, LA = left atrium, MV = mitral valve, LV = left ventricle.