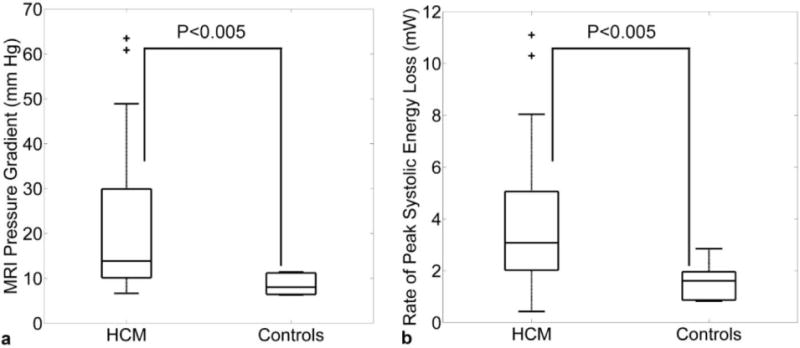
Figure 2.

(a) Estimated peak systolic LVOT Bernoulli pressure gradients and (b) LVOT peak systolic energy loss due to viscous dissipation in HCM patients and age matched normal controls. The individual box plots illustrate the median and the 25th and 75th percentiles (edges), the whiskers extend to the most extreme data points not considered outliers, outliers are plotted individually as ‘+’.
