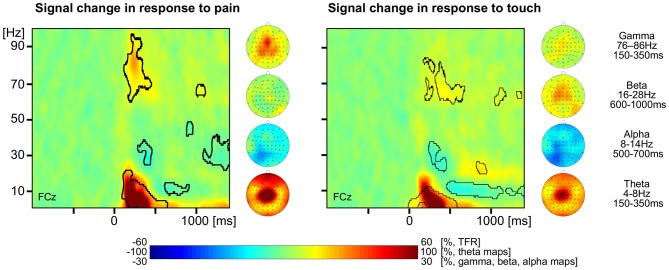
Figure 1.
Neuronal responses to pain and touch stimuli. Left, time-frequency representation (TFR) and topographical maps of pain-related neuronal activity coded as percent signal change with respect to a prestimulus baseline. Right, TFR and topographical maps of touch-related neuronal activity coded as percent signal change with respect to a prestimulus baseline. Areas with statistically significant responses (p < 0.05, false discovery rate (FDR) corrected) are framed by a black line.

