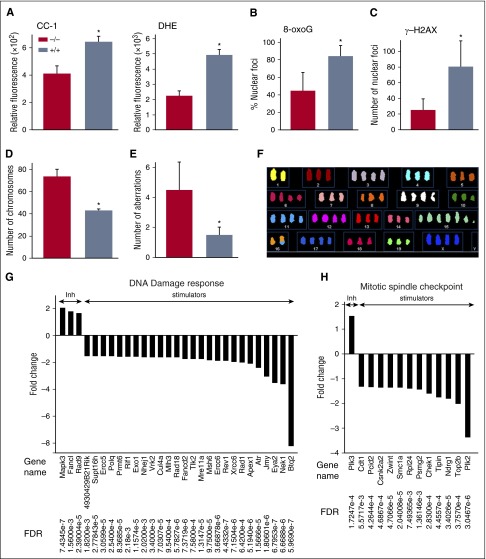
Figure 6.
ABL1 prevents accumulation of chromosomal aberrations in BCR-ABL1 leukemia cells. (A) Mean ± SD of relative fluorescence of ROS; CC-1 (left panel) and DHE (right panel) in BCR-ABL1 Abl1−/− and BCR-ABL1 Abl1+/+ leukemia cells; *P < .001. (B-C) Mean percentage ± SD of (B) 8-oxoG foci and (C) γ-H2AX foci in BCR-ABL1 Abl1−/− and BCR-ABL1 Abl1+/+ leukemia cells assessed by immunofluorescence in 4,6 diamidino-2-phenylindole (DAPI)-counterstained nuclei; *P < .001. (D-F) SKY analysis of BCR-ABL1 Abl1−/− and BCR-ABL1 Abl1+/+ leukemia cells based on the (D) number of chromosomes and (E) number of aberrations; results represent mean ± SD; *P < .001. (F) Representative image showing chromosome analysis of metaphase spread of BCR-ABL1 Abl1−/− leukemia cell using SKY. (G-H) Statistically significant (FDR < 0.05) fold changes (>1.5) of expression of indicated genes regulating (G) DNA damage response and (H) mitotic spindle assembly checkpoint in BCR-ABL1 Abl1−/− vs BCR-ABL1 Abl1+/+ leukemia cells maintained with SCF + IL-3.

