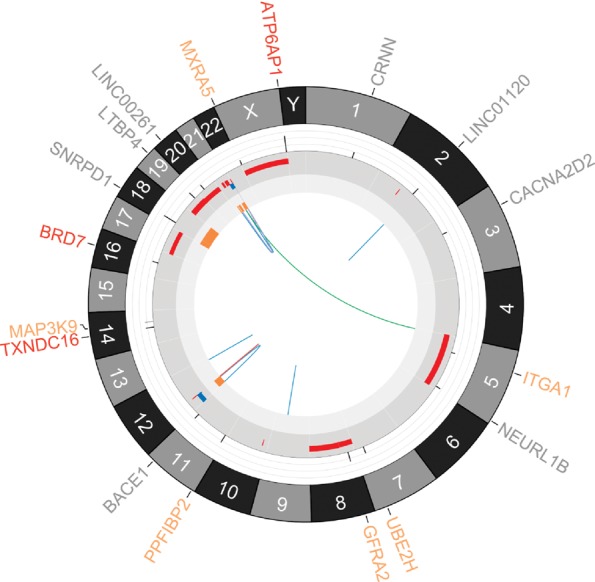
Figure 3.

Circos plot (Krzywinski et al. 2009) depicting genetic alterations identified by WGS analyses in granular cell tumor. From outer to inner components: amino-acid-changing point mutations in genes (red, truncating mutations including nonsense and splice-site single-nucleotide variants (SNVs); orange, alternating mutations including missense SNVs; gray, nonamino-acid-changing mutations, including silent or noncoding SNVs), chromosomes, variant allele frequency (VAF) bars for the corresponding point mutation (range = [0:1], the color of the VAF bar indicates coverage: light gray = 0–9×; gray = 10–29×; black = ≥30×), copy-number variations (red, gain; blue, loss), loss of heterozygosity, structural variations (red, insertion; blue, deletion; purple, intrachromosomal translocation; green, interchromosomal translocation).
