
Figure 5. SOX9+ Cells Expand Symmetrically During HF Morphogenesis.
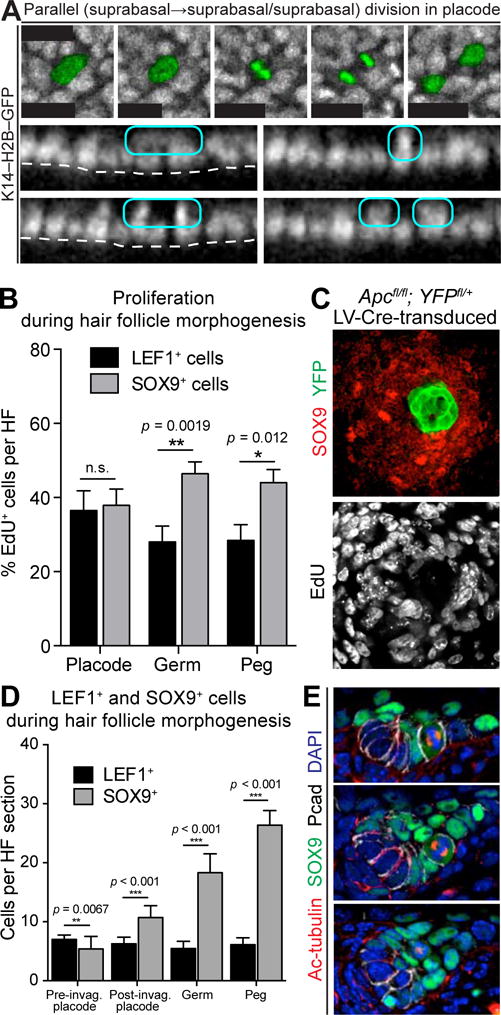
(A) Time course from live imaging of parallel suprabasal division in placode. (Top) Planar views centered in suprabasal plane with dividing cell pseudo-colored green. (Bottom) Sagittal views reconstructed from confocal stacks. Dividing cell circled in cyan. t=0 corresponds to onset of mitosis as determined by DNA condensation. 75 suprabasal divisions imaged from n=3 embryos. See Movie S4.
(B) Quantification of proliferation (4h EdU pulse) of SOX9+ and LEF1+ cells at different HF morphogenesis stages. Data from n=3 litters, 74 HFs and are mean ± SD.
(C) Planar confocal IMF of Apcfl/fl; R26YFPfl/+ epidermis transduced mosaically with LV-Cre, following 4h EdU pulse.
(D) Quantification of numbers of LEF1+ and SOX9+ cells at different HF morphogenesis stages. Data from n=3 litters, 117 HFs and are mean ± SEM.
(E) IMF of sagittal sections of HFs showing examples (arrows) of parallel, perpendicular, and suprabasal divisions in SOX9+ cells.
Tissues processed as indicated for IMF (SOX9, Acetylated-tubulin, Pcad, YFP) and EdU.
White dashed lines indicate basement membrane.
Scale bars in (A,E), 10μm; in (C), 20μm.
See also Figure S4.