
Figure 6. Antagonism Between WNT and SHH Signaling Orchestrates Differential Expansion of Two Daughter Populations.
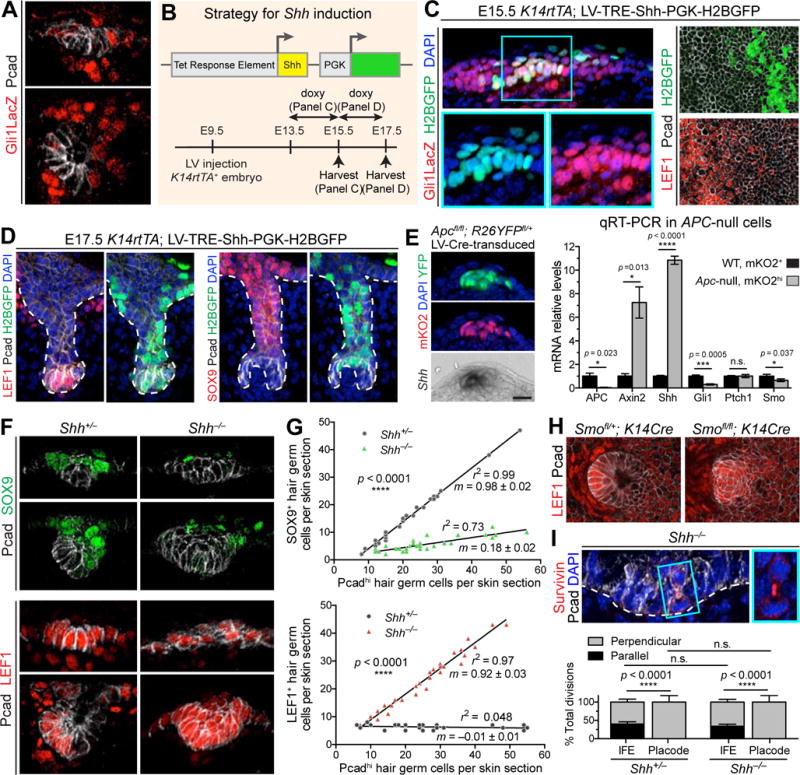
(A) IMF of sagittal sections of placode (top) and hair germ (bottom). Note low SHH-signaling (Gli1LacZ/βgal) in Pcadhi cells.
(B) Strategy for activating ectopic Shh in embryonic epidermis.
(C) Confocal IMF of sagittal sections (Left) and planar views (Right) of E15.5 Gli1LacZ epidermis transduced with LV-TRE-Shh, induced at E13.5, and immunolabeled for Gli1-LacZ (Left) or LEF1 (Right). Boxed area is magnified. Arrows denote autocrine SHH-signaling.
(D) IMF of sagittal sections of E17.5 HFs transduced with LV-TRE-Shh, induced at E15.5. Note that once HFs start to mature, SHH-transduced pocket cells (arrows) do not show signs of LEF1 reduction or SOX9 induction.
(E) (Left) Apc-null cells from Fucci; Apcfl/fl; R26YFPfl/+ epidermis transduced with LV-Cre. Note Shh induced in ectopic WNThi cells. (Right) Quantitative real-time (qRT-)PCR in FACS-purified Apc-null and WT cells from n=3 litters, mean ± SD.
(F) IMF of sagittal sections of Shh−/− and Shh+/− hair placode and germ.
(G) Quantifications of SOX9+ and LEF1+ cells relative to number of Pcad+ cells in sagittal sections of Shh−/− and Shh+/− HFs. m is slope ± standard error. r2 is coefficient of determination. Epithelial buds of same stage and size were compared from n=3 embryos, 54 HFs for SOX9, 105 HFs for LEF1.
(H) Planar confocal IMF of epithelial-specific Smoothened heterozygote and Smoothened-null hair bud showing LEF1 expanded suprabasally (brackets), as in Shh-null embryo.
(I) (Top) IMF of sagittal sections of Shh−/− hair bud showing perpendicular divisions occurring independently of SHH-signaling (boxed region magnified at right). (Bottom) Quantifications of division orientations in IFE and placodes of Shh+/− and Shh−/− placodes. Measurements based on spindle axis visualized by survivin and DAPI. Data are % ± SD (Shh−/−: 30 divisions in 13 HFs, 116 divisions in IFE; Shh+/−: 31 divisions in 11 HFs; 98 divisions in IFE).
Tissues processed as indicated for IMF (Gli1LacZ/βgal, Pcad, LEF1, SOX9, Survivin, YFP) or epifluorescence (mKO2).
White dashed lines indicate basement membrane.
All scale bars, 10μm, except in (C,H), 20μm.
See also Figure S5.