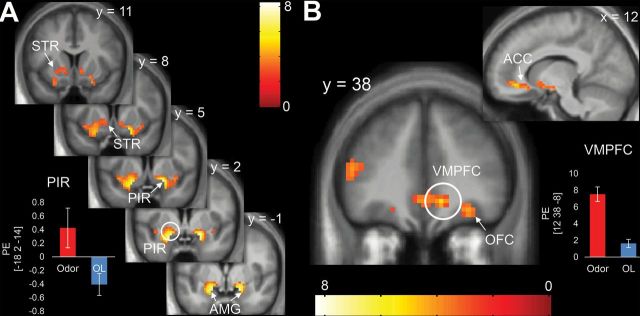
Figure 6.
Brain response to odors (Odor–OL Hungry + Sated). Sniffing odors versus OL stimuli led to significant activations in the (A) piriform (PIR; primary olfactory cortex) extending into amygdala (AMG) and striatum (STR) as well as (B) ventrolateral prefrontal cortex (VMPFC) extending into the anterior cingulate cortex (ACC) and orbitofrontal cortex (OFC; secondary olfactory cortex). Color bars represent t-values. Bar graphs show parameter estimates (PE) to Odor and OL at the peak voxel within each cluster. Error bars represent standard error. Circled areas indicate location of whole brain-corrected peaks.

