
Figure 8.
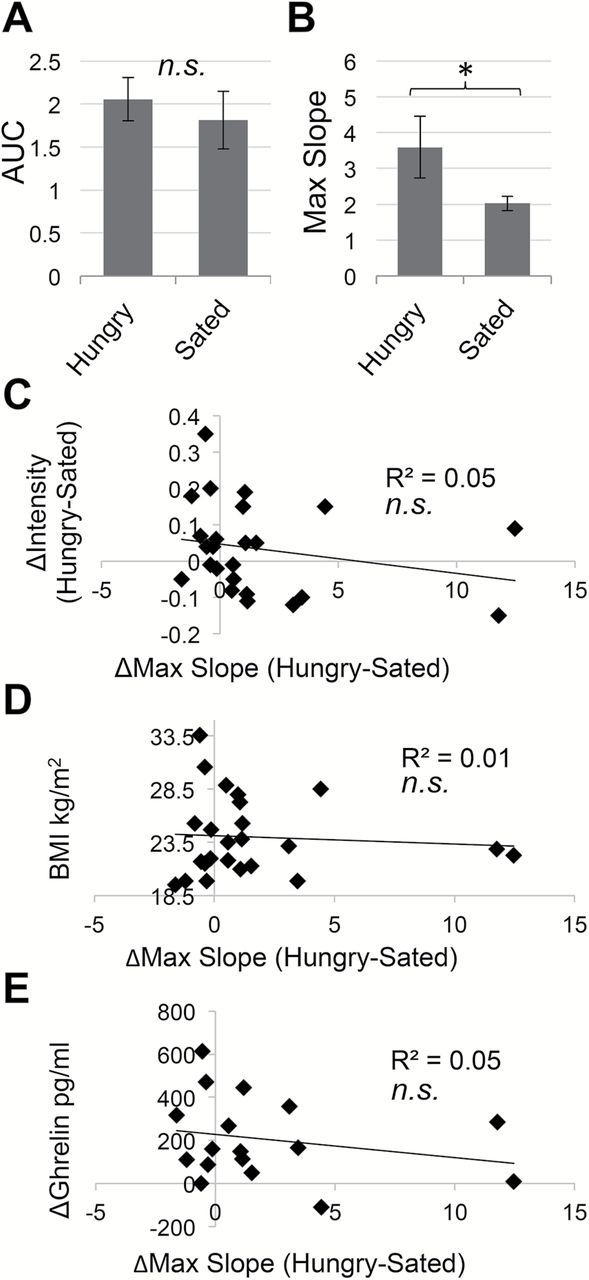
Sniffing behavior. Sniff parameters were assessed using repeated measures ANOVA. Error bars represent standard error of the mean. *P < 0.05; n.s., not significant. (A) Sniff volume (area under the curve, AUC) in response to odors did not differ between Hungry and Sated scans. (B) Sniff vigor (max slope) in response to odors was greater during Hungry versus Sated scans. Individual differences in sniff vigor did not correlate with (C) change in odor intensity perception Hungry–Sated, (D) BMI, or (E) raw postprandial ghrelin reactivity at 90min from baseline Hungry–Sated, as assessed using Pearson correlation.