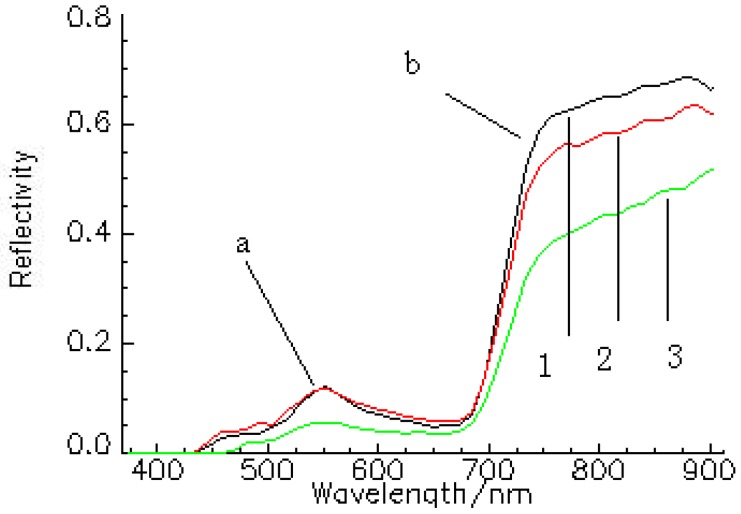
Figure 3.
Raw reflectance spectra of samples. The first reflectance spectrum is one sample of Juliang Farm, the second is one sample of Rougu Town, and the third is one sample of the Arid and Semi-arid Agriculture Institute of China. The peak at about 550 nm (a) represents the green light reflection region. The band at 690–720 nm; (b) represents the near-infrared to red edge region.

