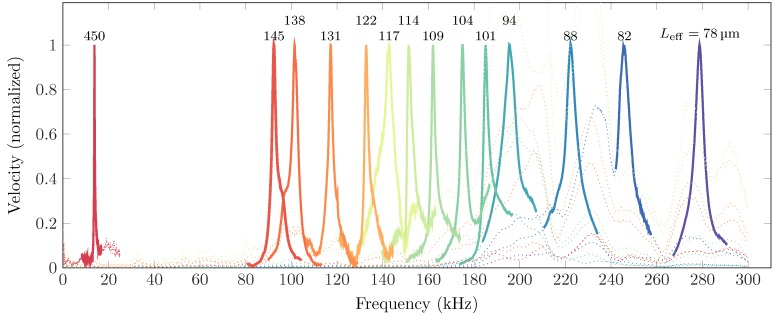
Figure 8.
The fundamental resonance frequency obtained for different adjusted lengths of the cantilever. The electrode position is varied and the cantilever is pulled-in for these positions, reducing its effective length. The cantilever is actuated with a frequency sweep and the response is shown in this figure. The numbers above the peaks indicate the effective length of the cantilever (in µm). Only the resonance peaks of the cantilever are shown in a solid line, while the rest of the bandwidth is plotted as a dotted line for clarity. All the measurements were made at an applied voltage of 60 V. More data and a detailed discussion is given in the supplementary material.

