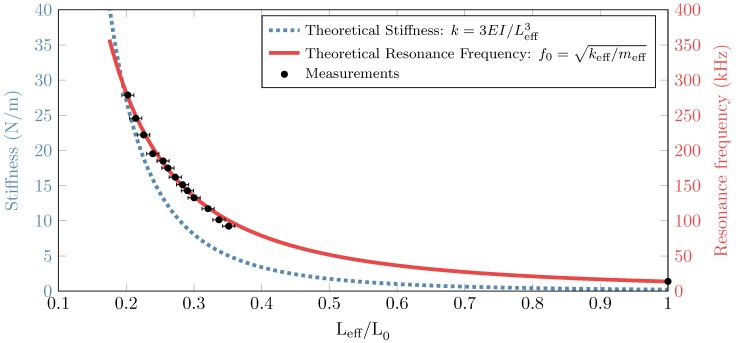
Figure 9.
Theoretical stiffness and resonance frequency compared with the measurements as a function of the normalized effective length. The measurement points correspond with the peaks found in Figure 8. The error bars correspond to the measurement uncertainty on the effective length.

