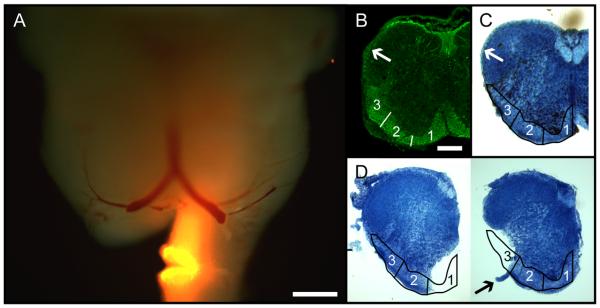
Figure 1.
Overview of retrograde labeling targeted to specific white matter zones. A: Whole-mount image of a P0 brainstem retrogradely labeled unilaterally at the level of the C2 ventral root, indicating how labeling was restricted to zone 1 and how contralateral contamination was stringently avoided by removing the uppermost part of the contralateral spinal cord. Diffuse fluorescence produced by retrogradely labeled neurons and axons can be discerned in both medulla and pons, most noticeably in the medial half of the ipsilateral medulla. The preparation is illuminated by both epifluorescence and incident white light to reveal tissue contours. B: Neurofilament immunostaining in a transverse section from the upper cervical spinal cord at P0, illustrating the distribution of axons in the white matter. Arrow indicates the dorsolateral fasciculus, which extends as a thin rind of white matter from the dorsal tip of the LF nearly to the dorsal midline (Sengul et al., 2012). Numbers 1–3 indicate the different zones used for selective retrograde labeling. C: Transverse section from the upper cervical spinal cord at P0, stained with methylene blue to show the white matter (light blue regions), with zones 1–3 (outlined) and the dorsolateral fasciculus (arrow) indicated. D: Transverse sections at C2 in preparations with labeling restricted to zone 1 (left) and zone 3 (right). Arrow in right panel indicates the C2 ventral root. Scale bars = 500 μm in A; 200 μm in B (applies to B–D).

