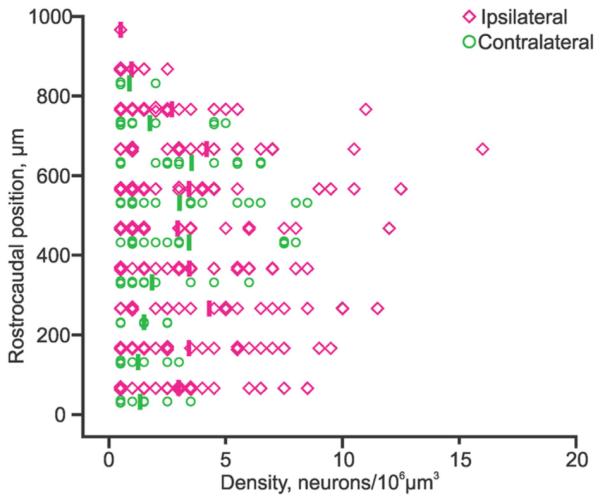
Figure 7.

pRS neuron density along the rostrocaudal axis. Graph showing density of ipsilateral (magenta lozenges) and contralateral (green circles) pRS neurons measured in 100-μm-on-a-side cubes along the rostrocaudal axis. Densities averaged below 5 neurons/106 μm3 but could reach over 10 neurons/106 μm3. For example, the single highest density (the magenta lozenge within the 600–700-μm bin) matches well the densely populated area indicated by the open arrow in Figure 2B.
