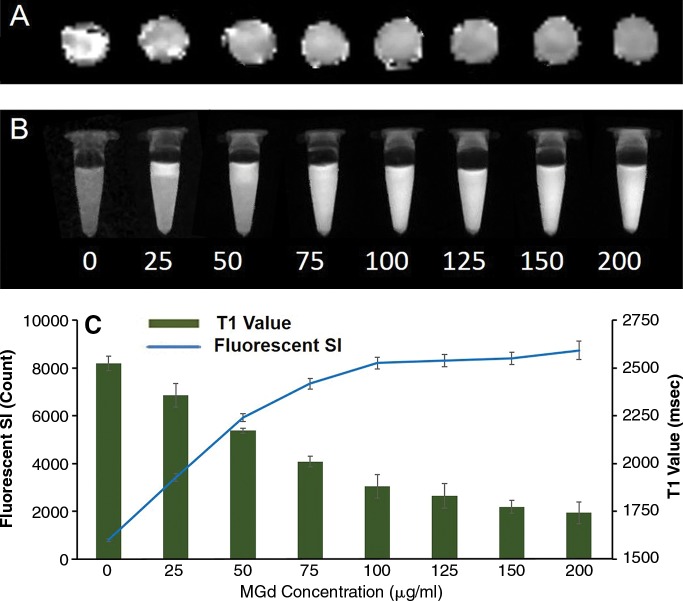
Figure 2:
Quantitative analysis of cells treated with MGd at different concentrations. A, MR imaging T1 map of glioma cells and, B, fluorescent optical image of cells at different concentrations from 0 to 200 μg/mL show that T1 value decreases and fluorescent signal (SI) increases as MGd concentrations increase. C, Graph shows T1 values and fluorescent signal compared with MGd concentration, further confirming that intracellular uptake of MGd increases as concentrations of MGd increase from 0 to 100 μg/mL and then maintains stable level as MGd concentration increases further.

