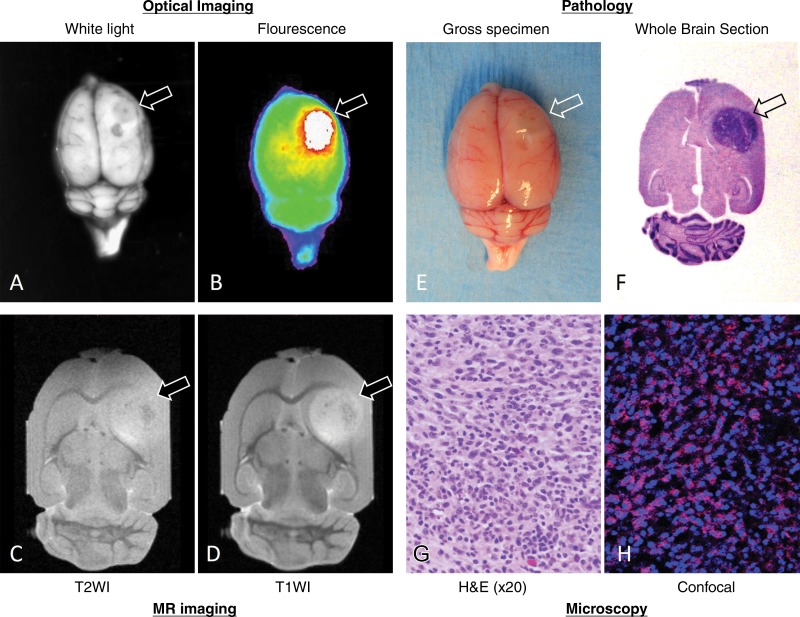
Figure 4:
Representative optical and MR images of MGd-enhanced rat glioma mass, with pathologic correlation and confirmation. A, Whole-brain white light image of tumor (arrow) and, B, overlay image of fluorescent tumor on white-light image clearly show margin of tumor outlined by MGd-emitting fluorescence. C, Axial non-contrast-enhanced T2-weighted (T2WI) MR image shows tumor with intermediate signal intensity (arrow). D, MGd-enhanced T1-weighted (T1WI) MR image shows heterogeneous and significant internal enhancement of tumor with clear margin. E, Whole-brain photograph displays tumor extruding (arrow) from surface of brain. F, Cross-sectional view of hematoxylin and eosin (H&E)–stained brain section shows tumor located in frontal caudate area (arrow) and, G, glioma tumor is confirmed by means of microscopy. H, Confocal microscopic image shows exclusive intracellular accumulation of MGd (pink spots in H) in glioma tumor cells.

