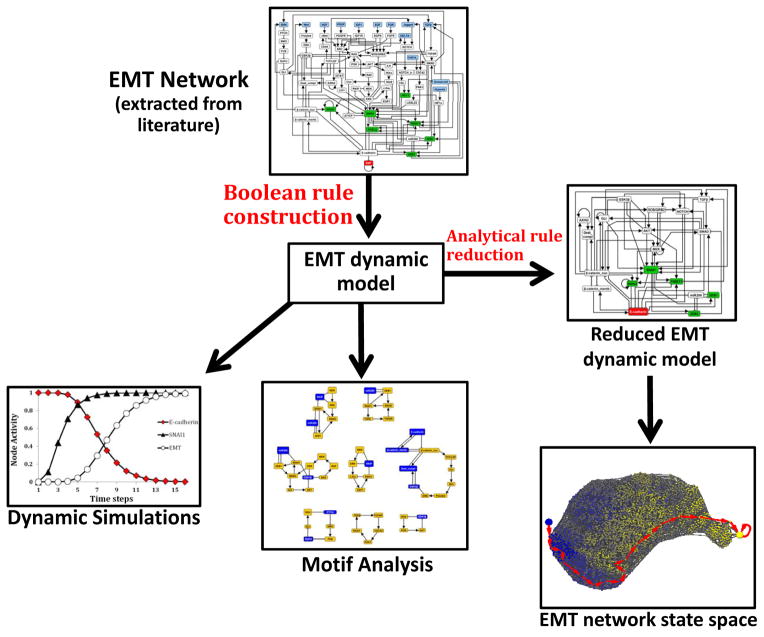
Figure 1. Flowchart of computational algorithms.
Our strategy was the following: we knew that TGFβ is a prominent signal driving epithelial-to-mesenchymal transition in hepatocellular carcinoma, so we started with synthesizing a network for this process from the literature. Then we added other known inducers of EMT and processes and components that are known to be deregulated during EMT. The resulting EMT network contains 70 nodes and 135 edges (EMT Network; Figure 3). We formulated a discrete dynamic model of this network by using our best estimation of the Boolean functions describing the regulation of each node. We then used simulations of the model to reveal the possible outcomes of TGFβ signaling in a cell that initially exhibits an epithelial phenotype (Dynamic simulations; Figure 4). To explore the full range of possibilities in terms of outcomes (steady states) the network can reach and ways in which these outcomes can be reached (trajectories), we performed a state space analysis. This analysis had to be preceded by network reduction to reduce the size of the network without disrupting its dynamic repertoire. State space analysis on the reduced network (Reduced EMT dynamic model; Figure 5) confirmed the results of the simulations. Furthermore, we used stable motif analysis to identify key feedback loops regulating EMT (Motif analysis; Figure 7A).

