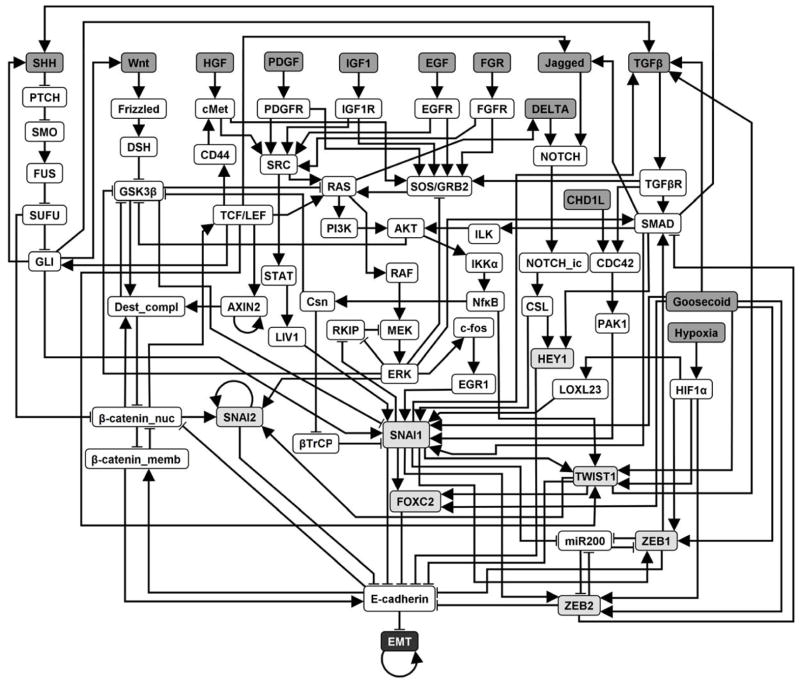
Figure 3. The 70 node, 135 edge network model representing the epithelial-to-mesenchymal transition (EMT) signaling network in HCC.
Nodes represent molecular entities (proteins, small molecules, mRNAs) and edges represent activating and inhibitory relationships between nodes. Upstream signals (black text, dark gray fill) regulate transcriptional regulators (black text, light gray fill) through signal transduction pathways, which all converge on the regulation of E-cadherin. The output of the network, “EMT”, is indicated by a symbol with black background and white text. The full names of the nodes are indicated in Supplemental Table 1. References for each edge in the network are indicated in Supplemental Table 2. The Boolean rules describing the dynamic EMT network model are given in Supplemental Table 3.

