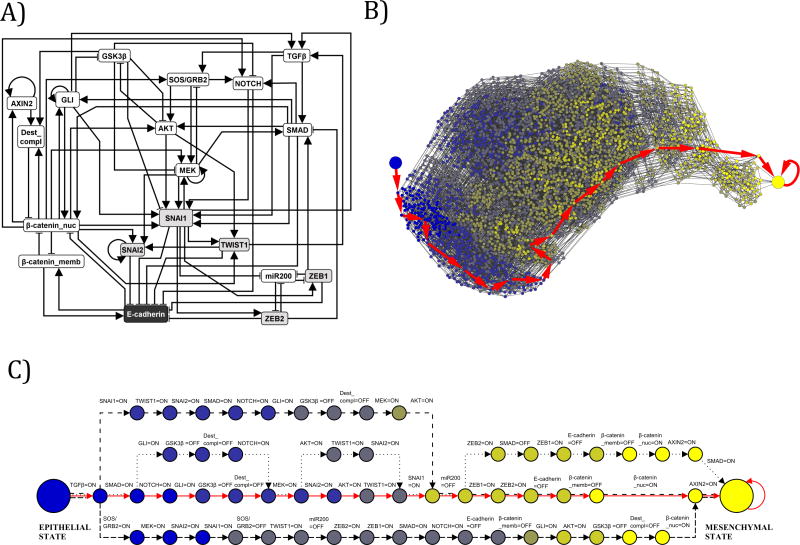
Figure 5. Network reduction and state space analysis of the EMT network.
A) Multiple network reduction techniques were applied to the 70 node, 135 edge EMT network to reduce it in size to a 19 node, 70 edge EMT network. This reduction maintains the network consistent with causal experimental observations, while permitting state space analysis that was not feasible on a larger network. The symbol shadings are the same as on Figure 3. The Boolean rules for the reduced EMT Network are included in Supplemental Table 5. B) In the reduced 19 node network, TGFβ was fixed as ON and the partial state transition network was explored from the initial epithelial condition, using a ranked asynchronous updating algorithm. These findings demonstrated that a single EMT steady state is realized through multiple trajectories, and that this steady state results from constitutive TGFβ signaling without dysregulations of any other nodes in the EMT network. This partial state transition network has 3,489 nodes (states) and 16,434 edges. Nodes are colored according to the number of stable motifs they have activated, with blue representing no stable motifs and yellow representing all of the stable motifs. The large blue node represents the initial epithelial condition just before TGFβ is turned ON, and the large yellow node represents the EMT steady state. The most probable trajectory in the state transition network is highlighted with large red arrows. All possible trajectories lead to the EMT steady state. C) The four most common trajectories in the state transition network, starting from the epithelial state (large blue node on the left) and terminating at the mesenchymal steady state (large yellow node at the right). Each node represents a network state. Each edge represents a transition between two states. Since a general asynchronous updating algorithm is implemented, a single node turns ON or OFF during each state transition; this node and its corresponding new state are indicated above the edge. For example, the second transition of all four trajectories corresponds to SMAD turning ON from an initially OFF state in the epithelial initial condition. The transitions corresponding to each of the four trajectories are identified by different line types (solid red, dashed, dash-dotted, dotted).

