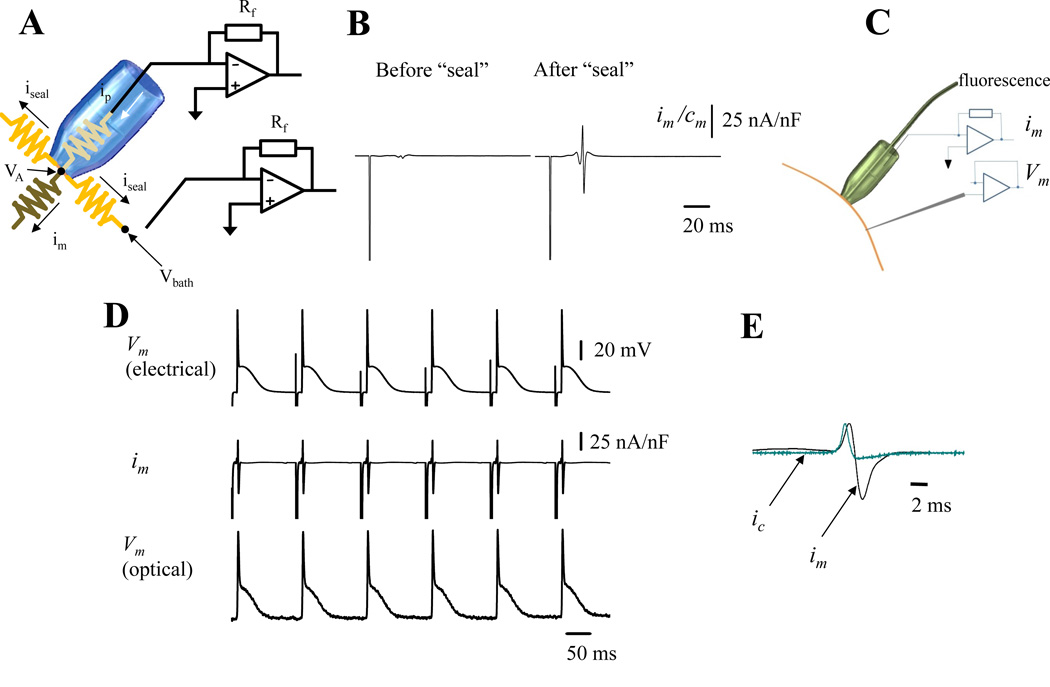
Figure 1. Recording transmembrane currents on epicardium.
A. An electrical scheme of the loose patch recording circuit. The bath and the interior of the pipette are clamped at the same potential. A second current to voltage converter sets the bath potential and acts as a guard to electrically increase the seal resistance. For more detailed information see Online Figure I B. Traces show the extracellularly recorded currents before and after the seal. Both recordings show a spike produced by the electrical stimulus applied at the apex of the heart to pace the organ. However, only the recordings obtained after the seal was applied show the membrane current during an AP. C. Scheme of the LPP arrangement showing a giant patch for measuring im, the intracellular microelectrode for electrically recording Vm and an PLFFM optical fiber positioned inside the giant pipette to optically record Vm optically. D. Electrical and optical recordings obtained from the epicardial layer of a mouse heart loaded with the potentiometric dye Di-8-ANNEPS and extracellularly paced at 6 Hz. E. Simultaneous recordings of the membrane current im (black) and the calculated capacitive current ic (teal). im is the summation of all the ionic currents plus the capacitive current under the patch. (n= 6 hearts).

