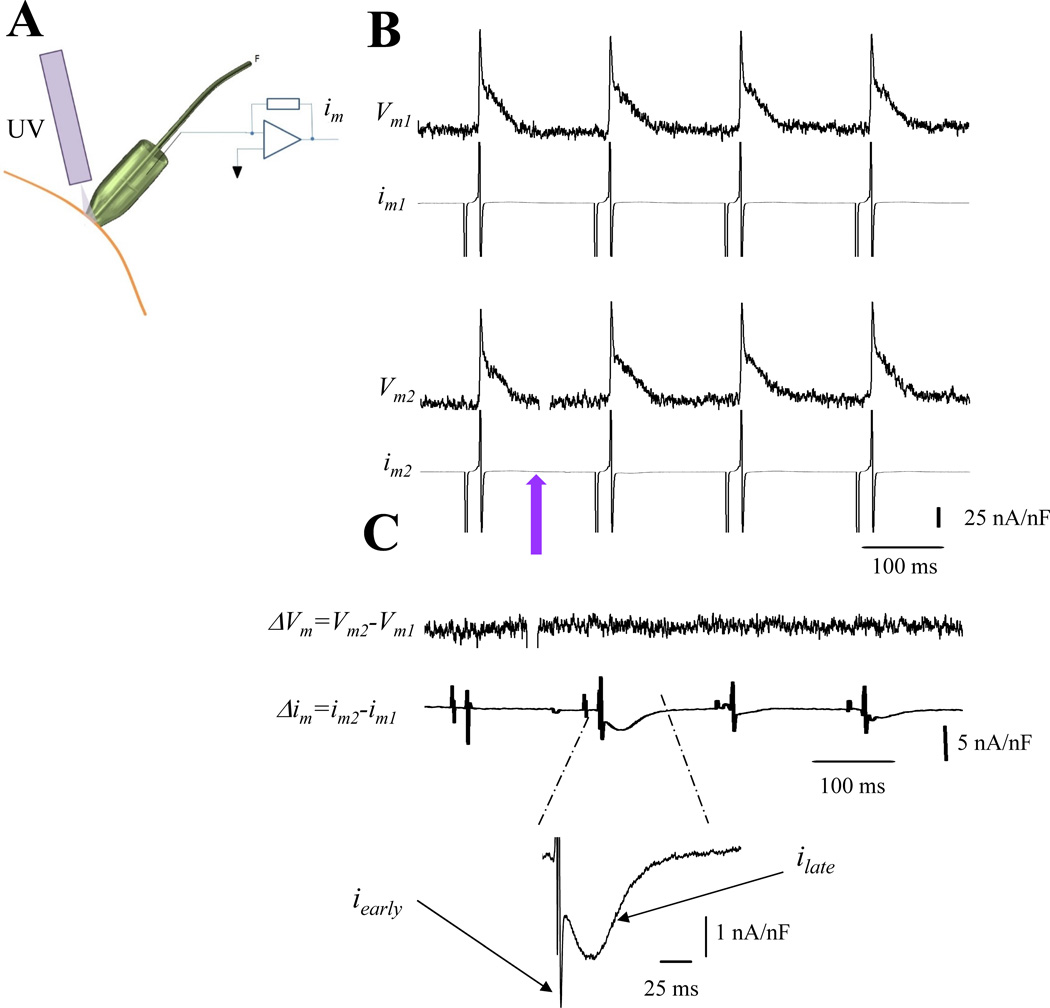
Figure 4. Dissecting ionic currents during triggered AP.
A. Experimental arrangement to measure optically Vm and electrically im during photolysis. B. Traces of APs and im in the presence of 10 µM nifedipine. Upper and lower records (e.g., Vm1 and im1 and Vm2 and im2) were recorded under identical conditions in the same location. The violet arrow indicates the time when nifedipine was photolyzed (traces Vm2 and im2). C. Difference between Vm2−Vm1 (ΔVm) and im2−im1 (Δim). No changes were observed in the differential trace (ΔVm) after nifedipine photolysis. However, the subtraction im2− im1 revealed a nifedipine sensitive current that displays an early fast component and a slower late component (n= 6 hearts).

