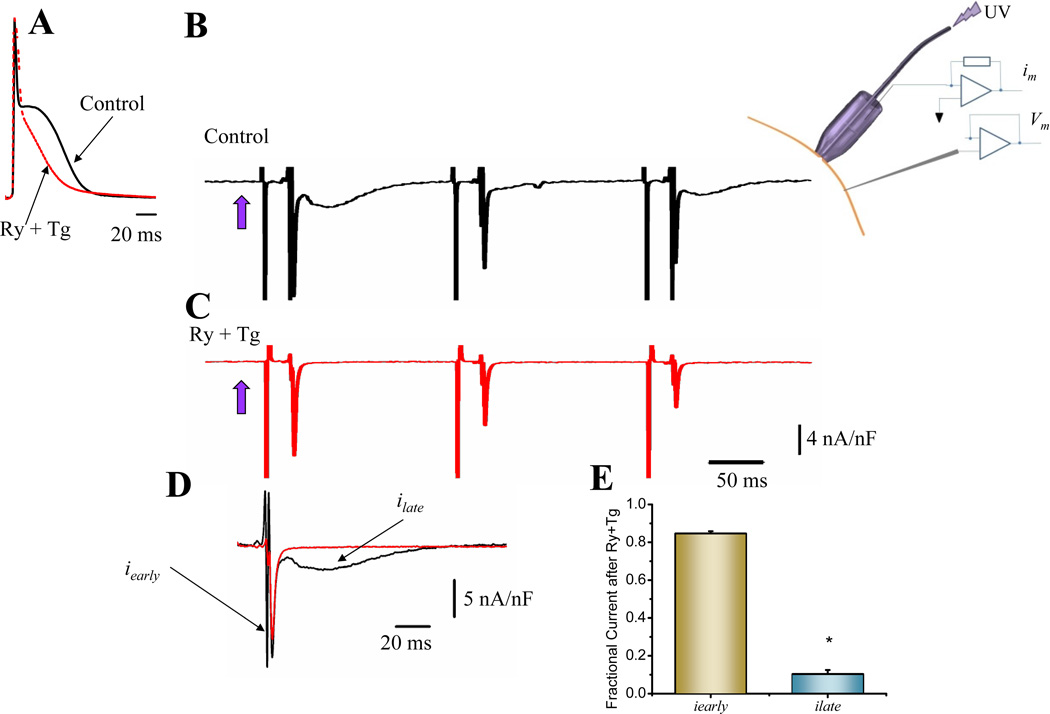
Figure 5. Ionic currents underlying action potential phase 2.
A. Effect of Ry (10 µM) and Tg (2 µM) perfusion on epicardial APs. The treatment had a strong effect impairing the development of AP phase 2 (n=18 hearts). B. Differential ionic current after photolysis (violet arrow) of 10 µM nifedipine (control) (n=22 hearts). C. Differential ionic current in a heart perfused with Ry and Tg (n=9 hearts). D. Comparison of ionic current traces in absence and in presence of Ry and Tg. E. Histogram showing that the late component ilate is highly inhibited by Ry and Tg whereas the early iearly is mostly unaffected (n=5 p<0.02).

