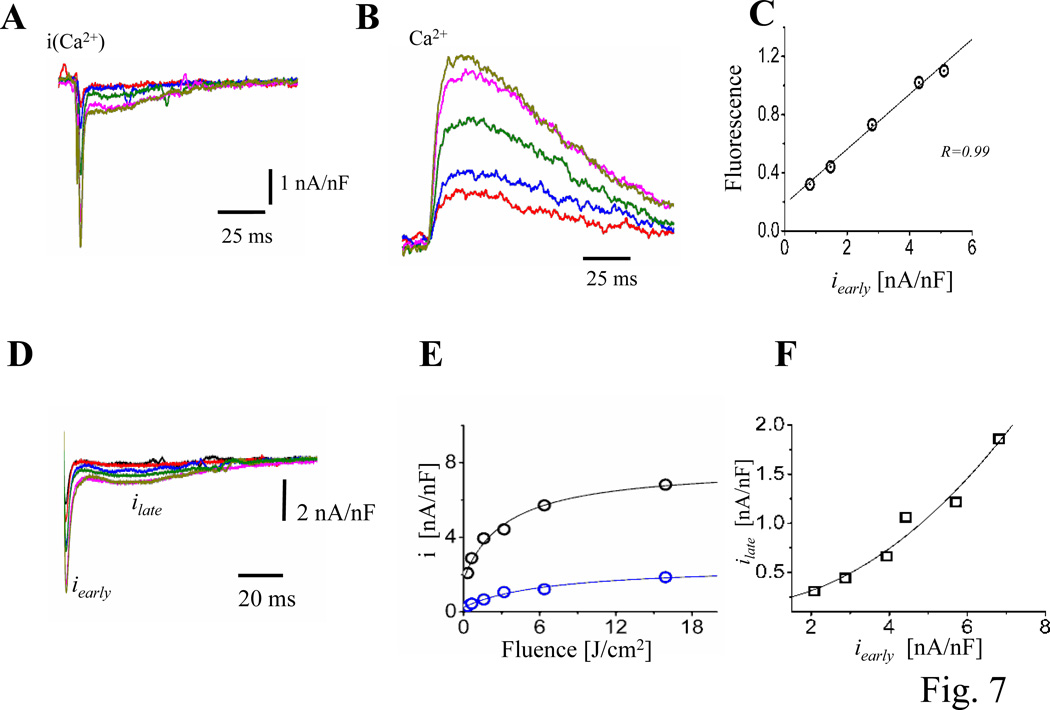
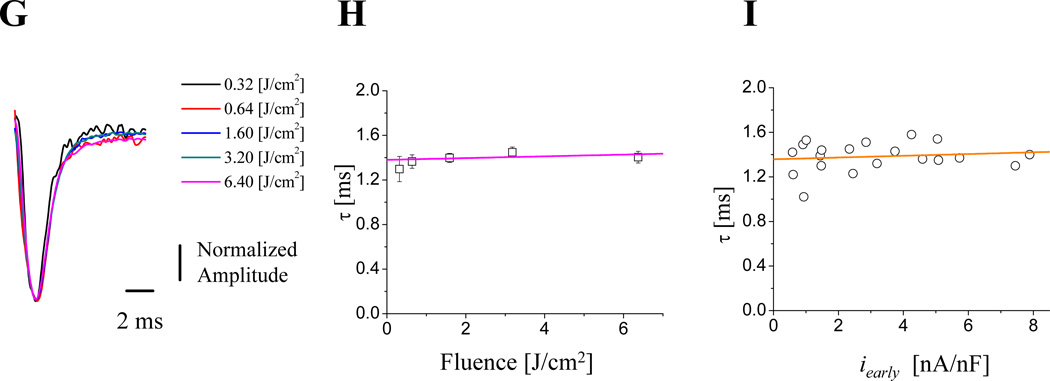
Figure 7. Testing the gain of CICR at the intact heart level.
A. Ionic currents during triggered APs illustrating the effects of varying the fraction of nifedipine broken down by applying UV pulses of different energies. Similar results were obtained in 6 hearts. B. Ca2+ transients, measured with X-Rhod-5F AM, recorded simultaneously at the same location where the ionic currents (panel A) were obtained. The colors of the fluorescent traces correspond to the LPP currents. C. Relationship between Ca2+ transients amplitude and iearly. There is a direct relationship between intracellular Ca2+ and the Ca2+ influx (n=3 hearts). D. Ionic current traces obtained with different flash energies in hearts not perfused with exogenous Ca2+ indicators. E. Fluence dependency of ilate (blue) and iearly (black), both current components saturate for high fluences indicating that at these energies all nifedipine molecules were locally broken down. F. Nonlinear relationship between ilate and iearly (n=15 hearts). G. Time courses of normalized early currents recorded at diferent fluences. H. Relaxation time constants of the early currents as function of the photolysis fluence. I. Relaxation time constants of the early currents as function of the peak early current amplitude. (n= 4 hearts).


