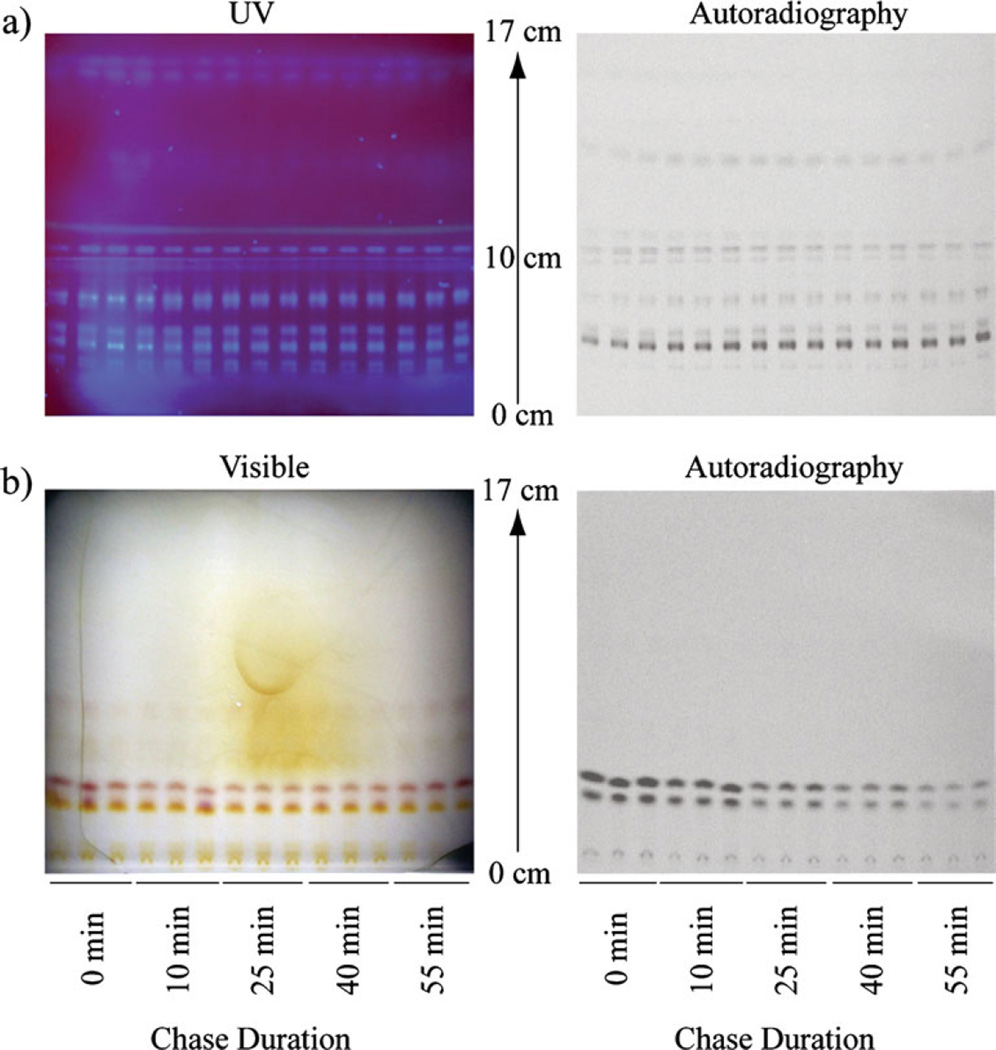
Fig. 2.
The metabolites from lipid- and water-soluble fractions were separated with TLC, visualized with either UV or visible light, and quantified with digital autoradiography. a Separation of the lipid-soluble metabolites from the pulse-chase experiments in WCH-17 cells. b Separation of the water-soluble metabolites from the pulse-chase experiments in WCH-17 cells.

