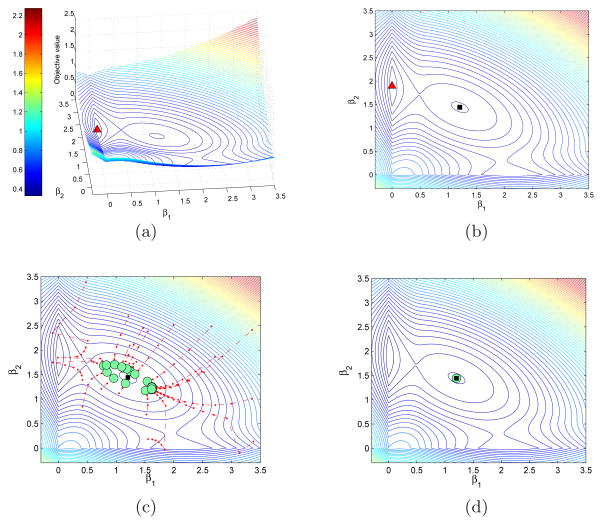
Fig. 3.
(a). 3-D contour plots of the 2-dimension LR-MCP problem and the solution generated by MIPGO in 20 runs with random initial solutions. The triangle is the MIPGO solution in both subplots. (b). 2-D representation of subplot (a). (c). Trajectories of 20 runs of LLA with random initial solutions. (d). Trajectories of 20 runs of LLA with the least squares solution as the initial solutions.

