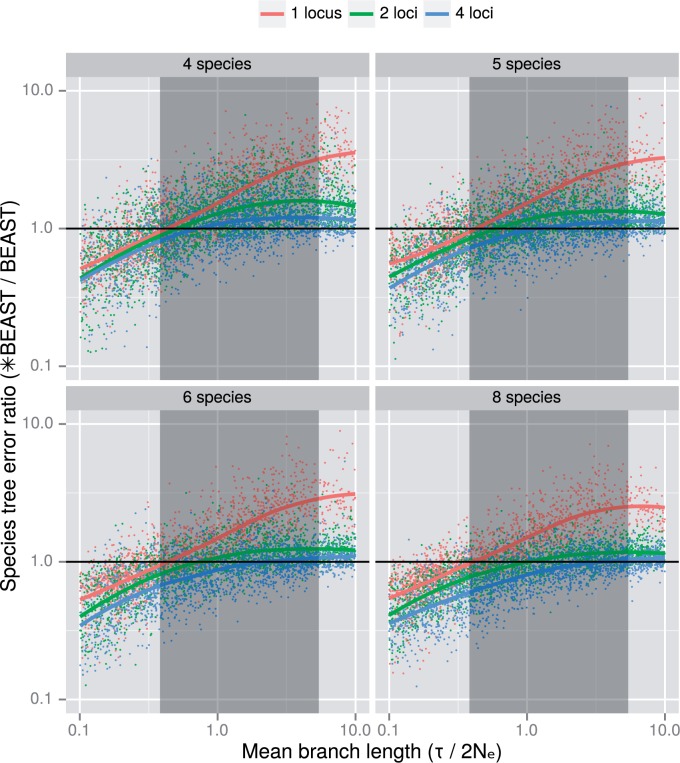
Figure 2.
Species tree error ratio (*BEAST/BEAST) as a function of the average species tree branch length (in coalescent units) for trees of 4, 5, 6, and 8 species. Data points are below 1 (black line) where the *BEAST error is lower than the BEAST error, indicating that *BEAST was more accurate than BEAST. Data points above 1 show the opposite. Only results with both mean branch lengths and error ratios between 0.1 and 10.0 are included. The red, green, and blue lines show the local regression for one, two and four locus estimates, respectively. The shaded region indicates where the crossover point depended on the combination of simulation parameters chosen—*BEAST was always preferred for average branch lengths shorter than this zone.

