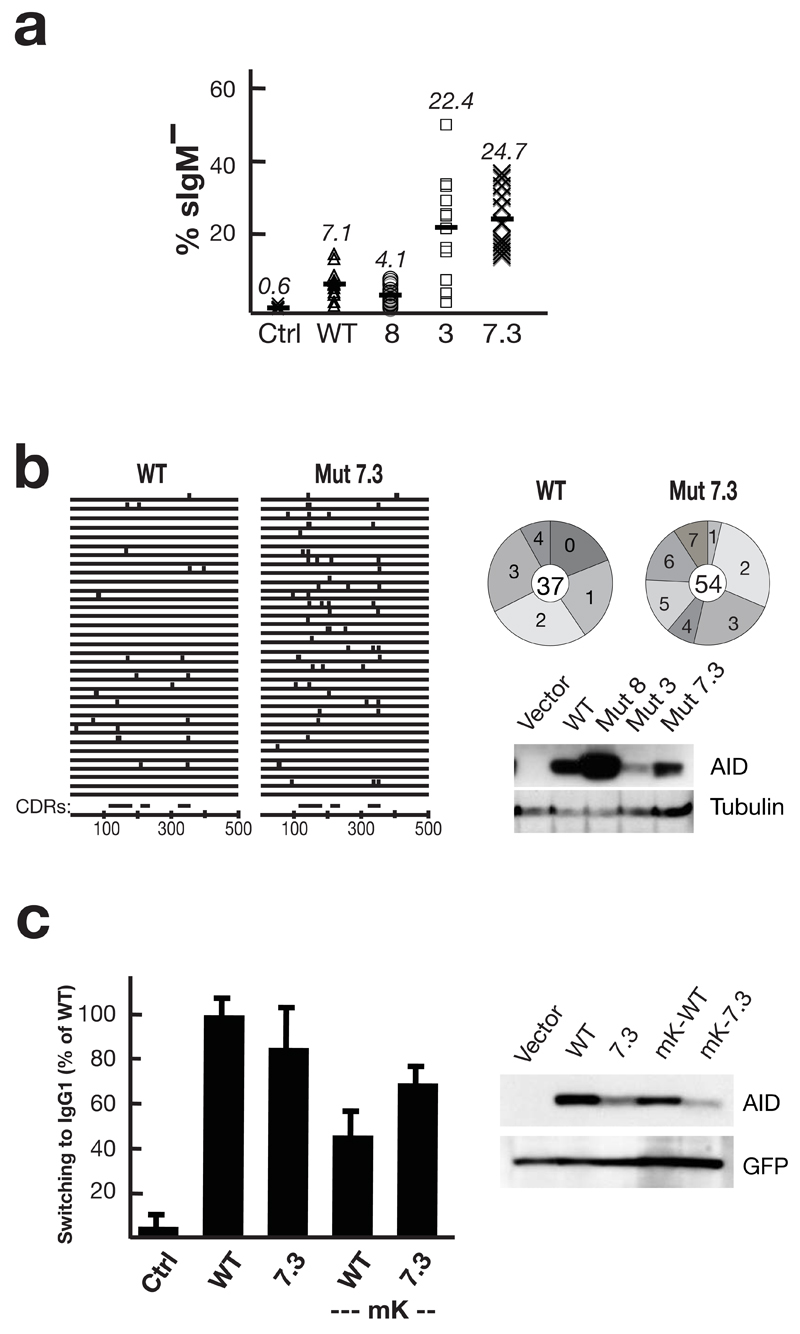
Figure 5.
Enhanced antibody diversification by AID upmutants. (a) Somatic mutation of the IgV was assayed by monitoring surface IgM-loss (% sIgM–) in AID–/– φV–/– sIgM+ DT40 cells that had been stably transfected with constructs co-expressing the indicated AID mutants together with GFP (mean of 12 independent clonal transfectants). (b) The distribution of mutations in 34 IgVλ sequences obtained by PCR amplification from unsorted WT/Mut7.3-transfected DT40 one month after transfection is shown on the left. The corresponding positions of the complementarity determining regions (CDRs) are shown below. On the right, pie charts depict the number of mutations in PCR amplified IgVλ sequences that had been obtained from the same transfectants but after sorting for sIgM-loss: the number in the middle of the pie chart indicates the total number of sequences analysed. Below the pie charts, Western blots show AID abundance in the DT40 cell extracts with tubulin as loading control. The IgVλ sequences are provided in Supplementary Fig. 3 online. (c) Histogram showing switching to IgG1 in LPS+IL4 cultures of AID-deficient B cells that have been transduced with GFP-(WT/Mut7.3) (mean and s.d. of four experiments). ‘mK’ indicates where transduction was performed using vectors with a mutated Kozak sequence, so as to reduce the extent of AID overexpression. A Western blot shows AID abundance in the B cells extracts 3 days after retroviral transduction; the blot was reprobed with anti-GFP antibodies as a control. Representative flow cytometry plots for (a) and (c) are shown in Supplementary Fig. 4 online.

