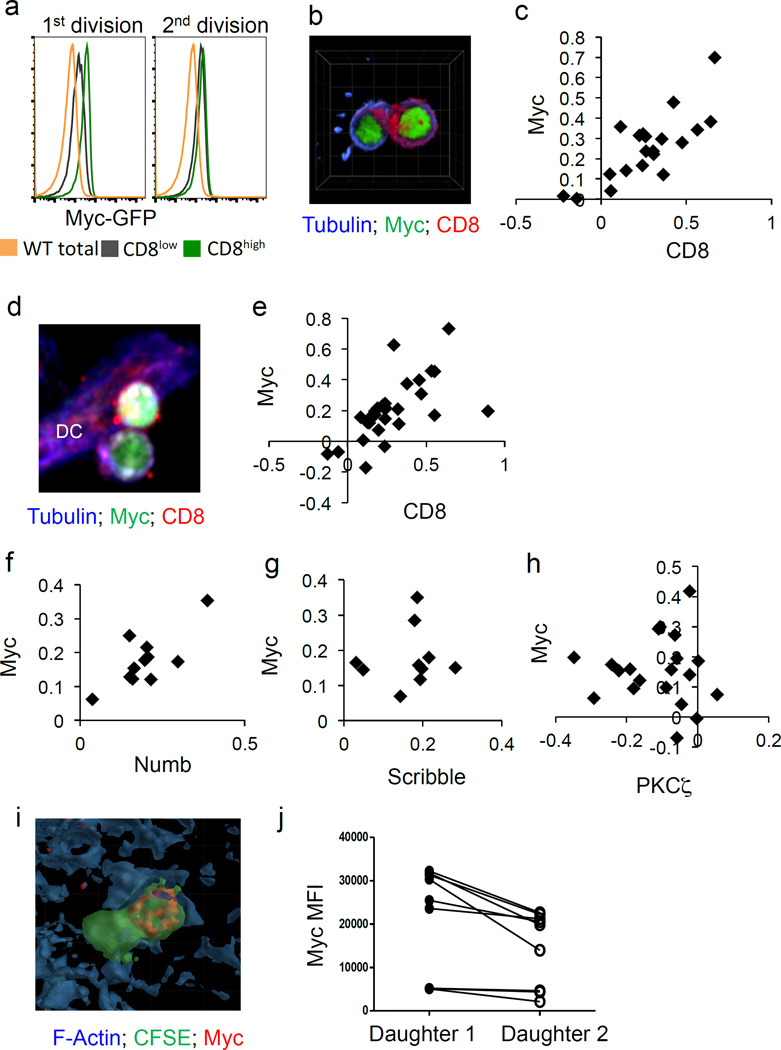
Figure 1. C-Myc asymmetrically segregates to the proximal daughter in activated CD8 T lymphocytes.
(A) Mean fluorescent intensities (MFI) of c-Myc-GFP in negative (wt cells; gold histogram), CD8low (gray histogram), and CD8high (green histogram) cells in the first (left panel) and second (right panel) divisions. Representative of four independent experiments. (B) Representative image of conjoined daughter c-Myc-GFP CD8 T cells (antibody-coated plates) fixed and stained for beta tubulin (blue) and CD8 (red). (C) Quantification of asymmetry based on fluorescent intensities of CD8 (difference/total; x axis) and c-Myc-GFP (difference/total; y axis). 88.9% bright in same daughter (p=0.0004 Two-Tailed Binomial Test); r2=0.6159, p<0.0001 Linear Regression. Compiled from four independent experiments; each point represents a conjoined daughter pair. (D–E) Representative image and quantification of asymmetry of conjoined daughter OT-I cells co-cultured with BMDCs. 86.2% both bright in proximal daughter (x2=58.31, DF=3, p<0.0001 Chi-Square Goodness of Fit); r2=0.3939, p=0.0003; Linear Regression (F–H) Quantifications of asymmetry (difference/total) of ACD markers Numb 100% both bright in proximal daughter (x2=33, DF=3, p<0.0001 Chi-Square Goodness of Fit); r2=0.5738, p=0.0069 Linear Regression (F), Scribble 100% both bright in proximal daughter (x2=30, DF=3, p<0.0001 Chi-Square Goodness of Fit); r2=0.01436, p=0.7416; Linear Regression (G), and PKC zeta 85% PKC zeta bright in distal daughter, c-Myc bright in proximal daughter (x2=26.8, DF=3, p<0.0001 Chi-Square Goodness of Fit); r2=0.0009705, p=0.8963 Linear Regression (H). (I–J) Representative image and quantification of c-Myc fluorescence of dividing OT-I T cells in spleen sections of animals infected with Listeria-OVA, p=0.0077; Paired Student’s T. Compiled from two independent experiments

