
Ext. Data Fig. 7. Regulation of phospho mTOR and TORC1 signaling by c-Myc.
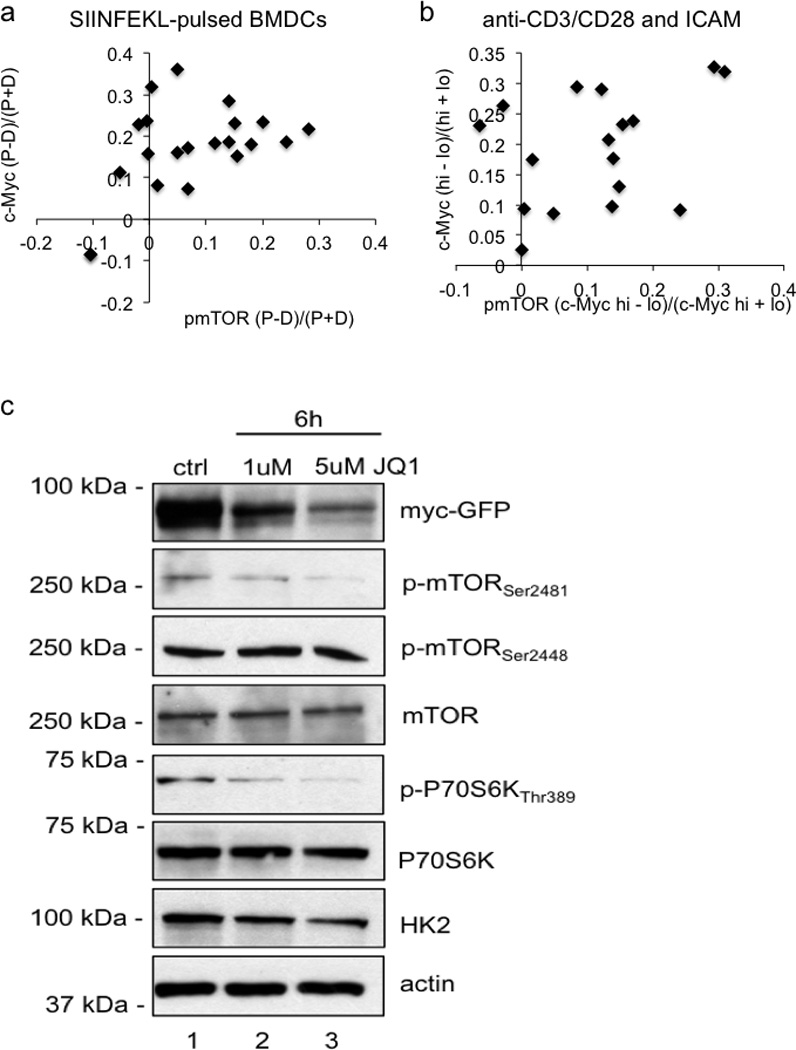
Quantification of p-mTOR staining and c-Myc-GFP for OT-I CD8 T cells co-cultured with SIINFEKL-pulsed BMDCs 80.9% both bright in proximal daughter (x2=25.67, DF=3, p<0.0001 Chi-Square Goodness of Fit Test); r2=0.2307, p=0.0275 Linear regression (A) or T cells stimulated for 36 hours on anti-CD3, anti-CD28, and ICAM 82.4% both bright in same daughter (p=0.0013 Two-Tailed Binomial Test); r2=0.1204, p=0.1725 Linear Regression (B). Asymmetry as assessed by fluorescence intensity is expressed as (proximal-distal)/total (A), or values from (Mychigh-Myclow)/total (B). (C) Western blot analysis of CD8 T cells activated on anti-CD3, anti-CD28, and ICAM for 6 hrs without treatment (ctrl) or with 1uM or 5uM JQ1. Data are representative of three independent experiments.