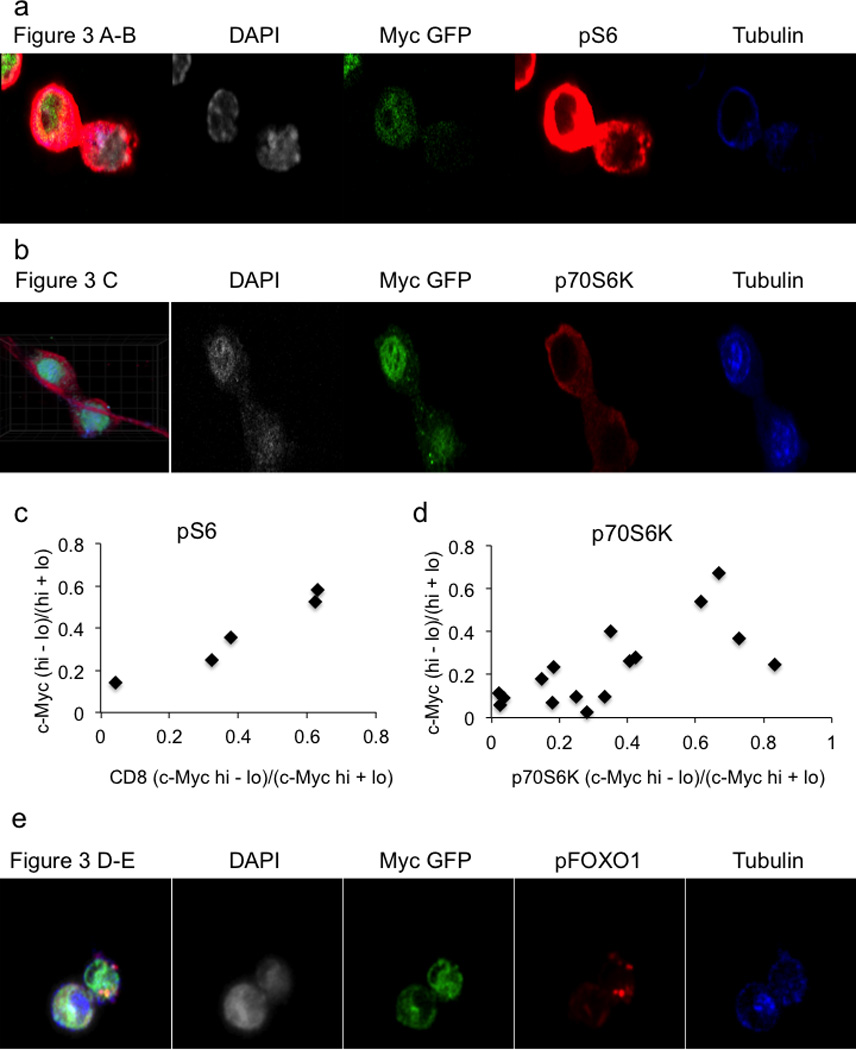
Ext. Data Fig. 8. Asymmetric assortment of mTORC1 activity with c-Myc-GFP.

Representative confocal images for quantifications of c-Myc-GFP and pS6 staining corresponding to Figure 3A–B (A) or c-Myc-GFP and p70S6K corresponding to Figure 3C (B) in OT-I T cells co-culture with SIINFEKL pulsed BMDCs. Quantifications for c-Myc-GFP and pS6 100% both bright in same daughter (x2=19.89, DF=3, p=0.0002 Chi-Square Goodness of Fit Test); r2=0.9457, p=0.0055 Linear Regression (C) or p70S6K 100% both bright in same daughter (x2=14.14, DF=3, p=0.0027 Chi-Square Goodness of Fit Test); r2=0.4875, p=0.0026 Linear Regression (D) staining in T cells stimulated on anti-CD3, anti-CD28, and ICAM for 36 hours. (E) Representative confocal images for quantifications of c-Myc-GFP and pFOXO1 staining corresponding to Figure 3D–E. T cells stimulated on anti-CD3, anti-CD28, and ICAM for 36 hours.
