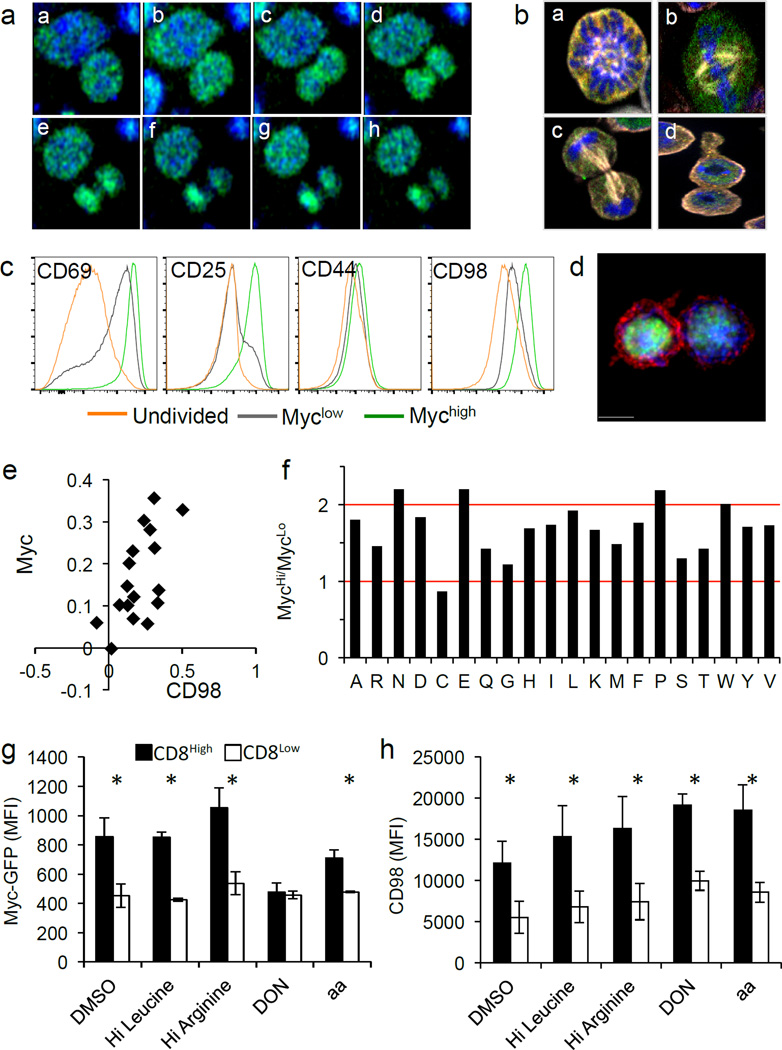
Figure 2. Amino acid metabolism is necessary for the maintenance of c-Myc asymmetry in activated CD8 T cells.
(A) Time-lapse of dividing c-Myc-GFP OT-I cells co-cultured with BMDCs. 4 min. intervals (a–h). (B) Fixed T cells (antibody-coated plates) stained with Hoechst 33258 (blue) and anti-Beta Tubulin (white) to identify the stages of mitosis: prophase (a), metaphase (b), anaphase (c), telophase/cytokinesis (d). (C) MFI of indicated activation markers for activated, undivided T cells (gold) first division c-Myclow T cells (gray), or first division c-Mychigh T cells (green) (antibody-coated plates). Representative of four independent experiments. (D–E) Representative image and quantification of fluorescent intensity (difference/total) of CD98 (red) in T cells co-cultured with BMDCs. 88.2% both bright in proximal daughter (x2=36.41, DF=3, p<0.0001 Chi-Square Goodness of Fit); r2=0.3886, p=0.0075 Linear Regression (F) Ratio of amino acids in c-Mychigh versus c-Myclow first division CD8 T cells. Values normalized in terms of raw area counts. (G–H) MFI of c-Myc-GFP (G) or CD98 (H) in first division CD8high (shaded bars) and CD8low (open bars) (35 hours on antibody-coated plates) and indicated treatment for 45 minutes (amino acid starvation, four hours). Mean ± SD (n=3 mice/group). *p<0.05. Representative of two independent experiments.

