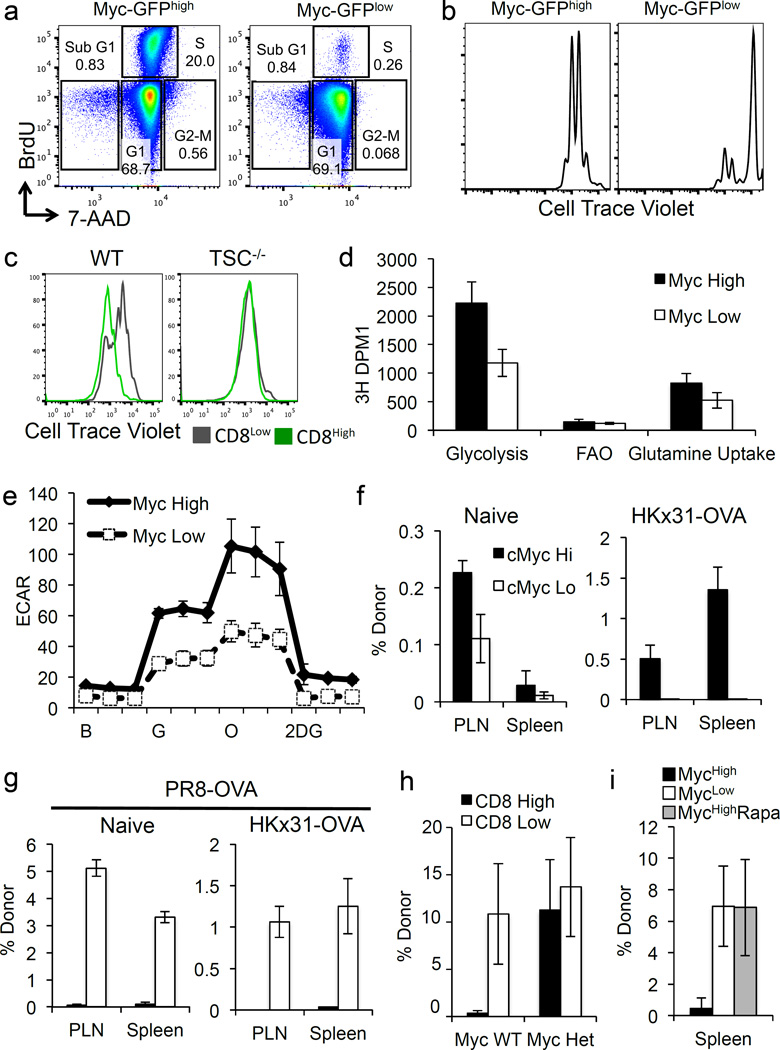
Figure 4. T cell proliferation, metabolism, and fate are directed by differential expression of c-Myc protein.
(A) Representative flow plots for first division c-Myc-GFPhigh (left panel) and c-Myc-GFPlow (right panel) cells (antibody-coated plates + 1hr BrdU). (B) Cell Trace Violet dilution of antibody-activated, sorted first division c-Myc-GFPhigh and c-Myc-GFPlow T cells after culture for 38 more hours. (C) Populations in Figure 3H, sorted and cultured 48 more hrs; Cell Trace Violet dilutions of CD8high cells (green histograms) and CD8low cells (gray histograms) shown. (D) Sorted first division c-Myc-GFPhigh (shaded bars) and low (open bars) CD8 T cells were re-plated with [3-3H]-glucose, [9,10-3H]-palmitic acid, or [3H]-glutamine. Mean (± S.D.) D.P.M.I. of triplicates (n=3 mice/group). (E) ECAR of sorted first division c-Mychigh (shaded symbols) and c-Myclow (open symbols) T cells during exposure to indicated compounds. Mean ± S.D. for three replicates, pooled from two mice. Representative of three independent experiments (Ext. Data Fig. 10). (F–G) Frequency of donor cells two weeks post transfer of 5×10⁵ first division c-Myc-GFPhigh or low OT-I cells into naïve or infected recipients. (G). Frequencies of OT-I donor cells at 9d post challenge (PR8-SIINFEKL after 2 weeks rest), mean± S.D. (n=3 mice/group, representative of two independent experiments). (H) Frequencies of donor cells from either c-Myc WT (p=0.0059 Student’s T Test) or c-Myc+/− mice (p=0.4040 Student’s T Test) 9d after challenge (Mean ± S.D., n≥4 mice/group). (I) Frequencies of donor cells from recipients treated with PBS (p=0.0128 Student’s T Test) or rapamycin (p=0.9726 Student’s T Test) 9d after challenge (Mean ± S.D., n≥3 mice/group).

