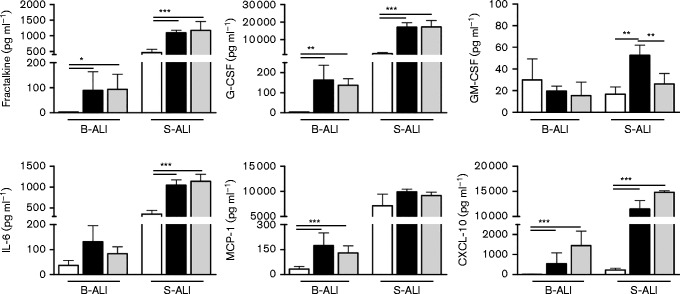
Fig. 5.
Quantification of cytokines and chemokines secreted by B- and S-ALI. Cytokines/chemokines secreted from the basal side of control (white) or high m.o.i. NiV-M-infected (black) and NiV-B-infected (grey) B- and S-ALI at day 7 p.i. Results are expressed as the mean of three biological repetitions and bars represent standard deviation. *P < 0.05, **P < 0.01 and ***P < 0.001, ANOVA, Bonferroni's multiple comparison test.

